![]() Present the BSC Designer to key stakeholders involved in strategic planning.
Present the BSC Designer to key stakeholders involved in strategic planning.
Empowering Strategies Worldwide
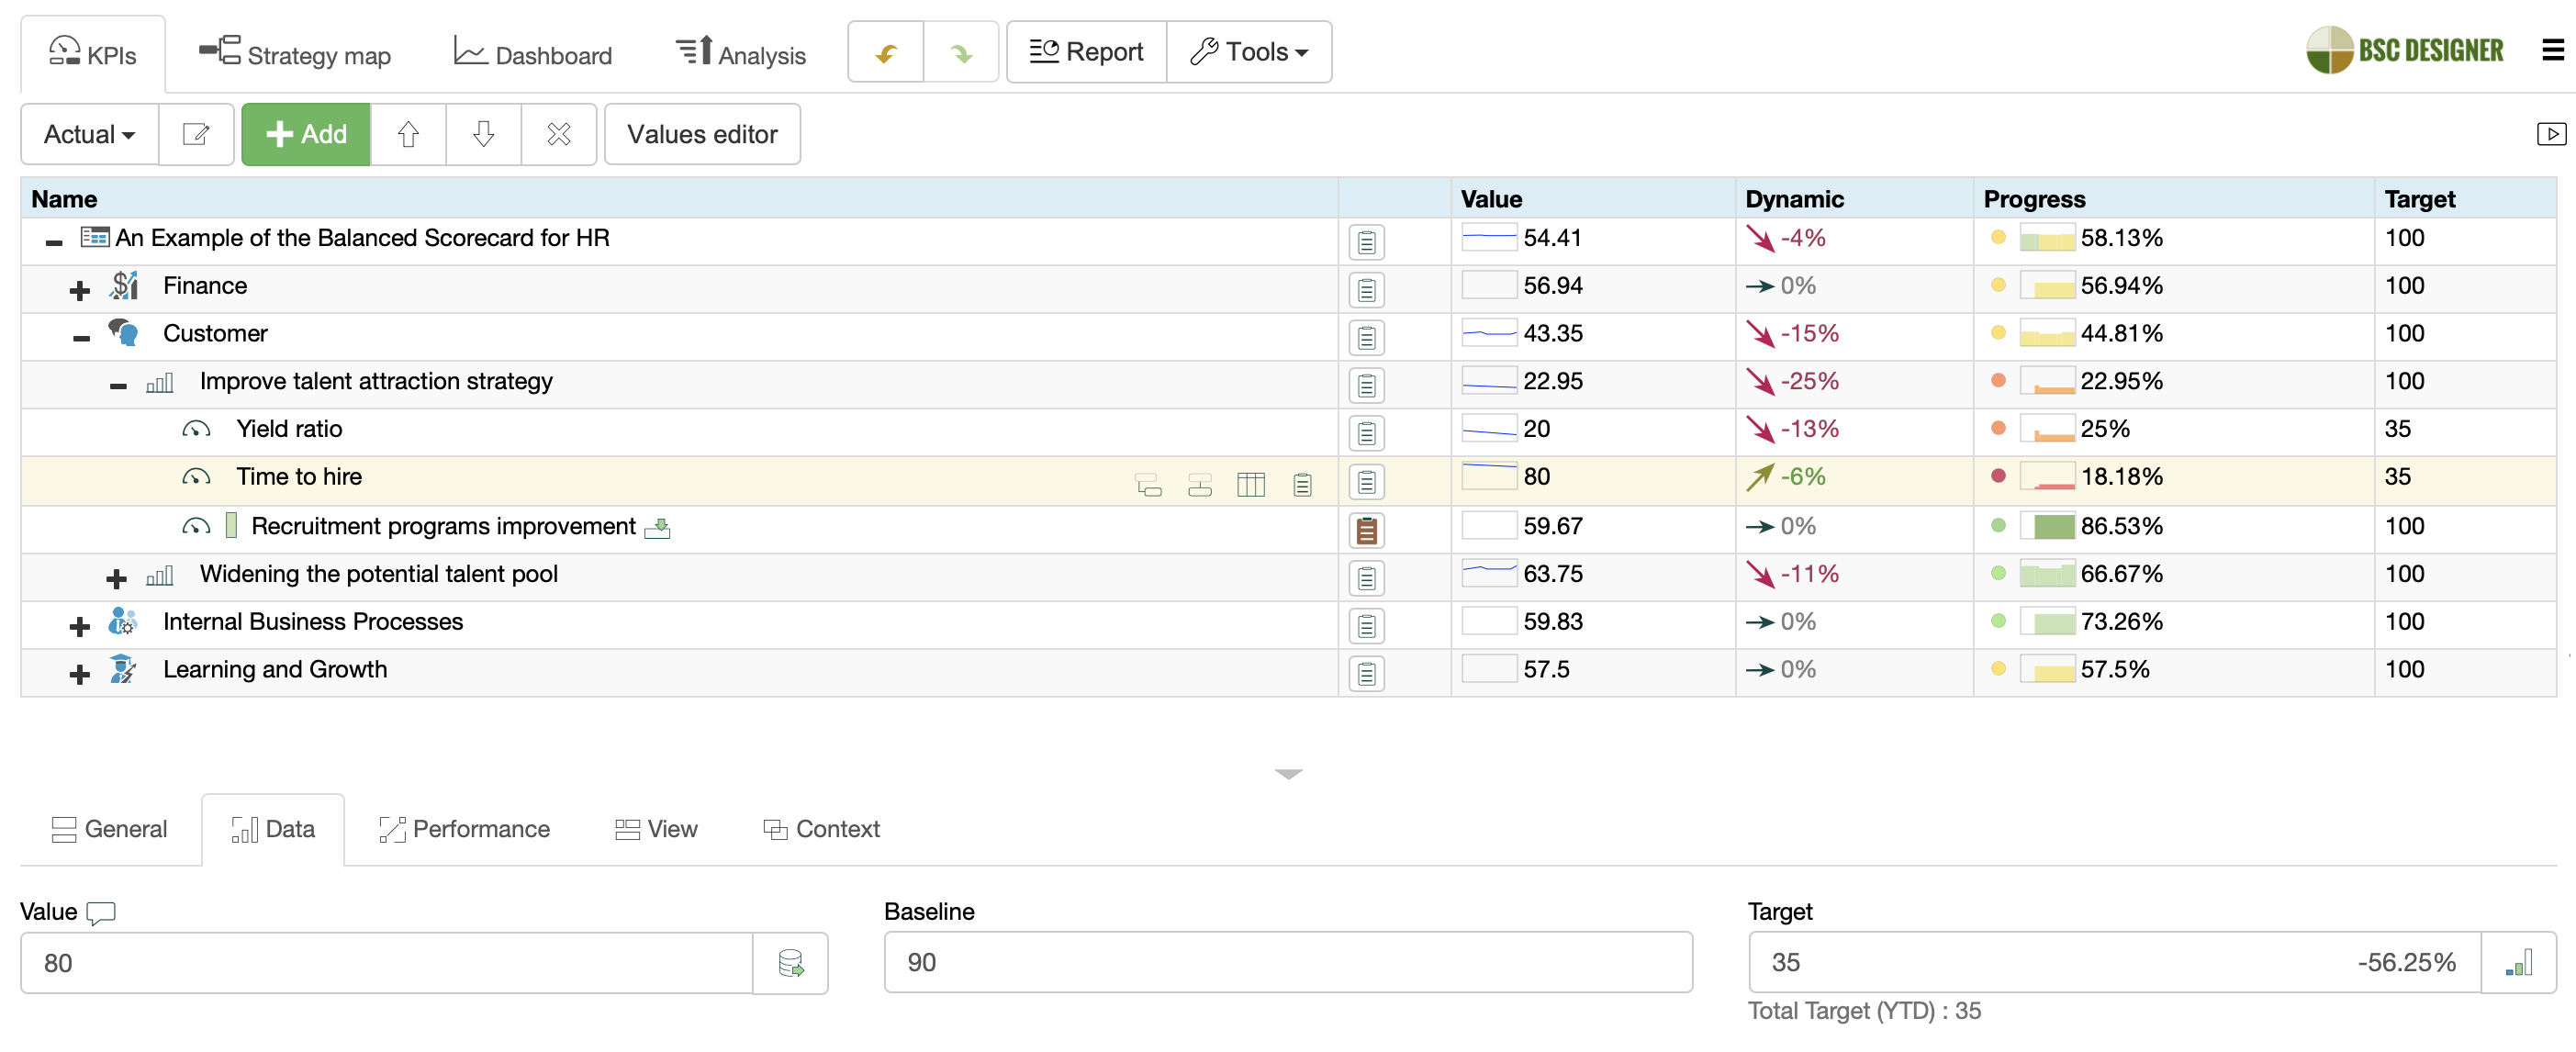
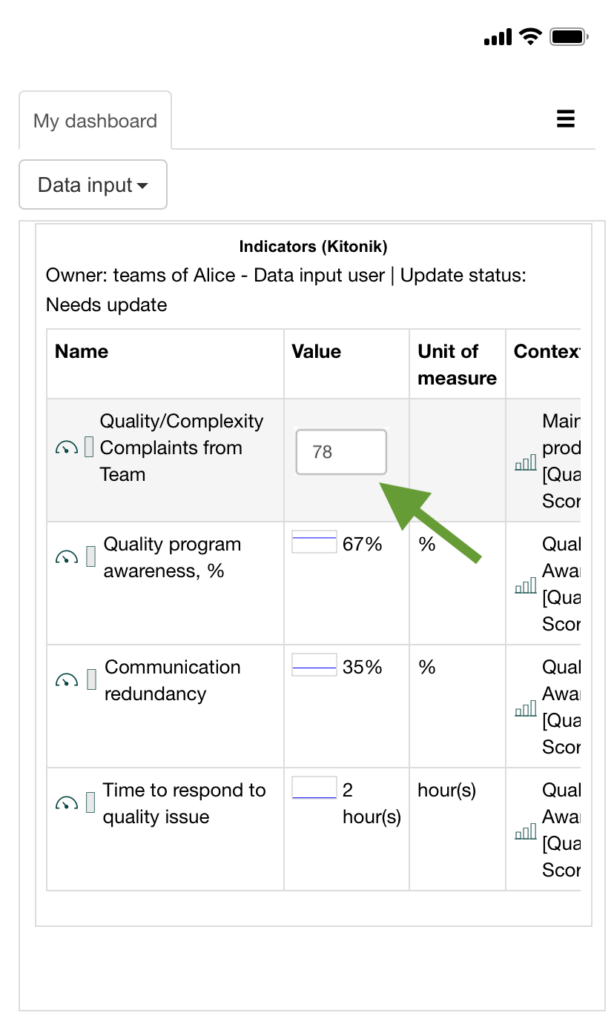
Make Your Goals Tangible by Defining KPIs
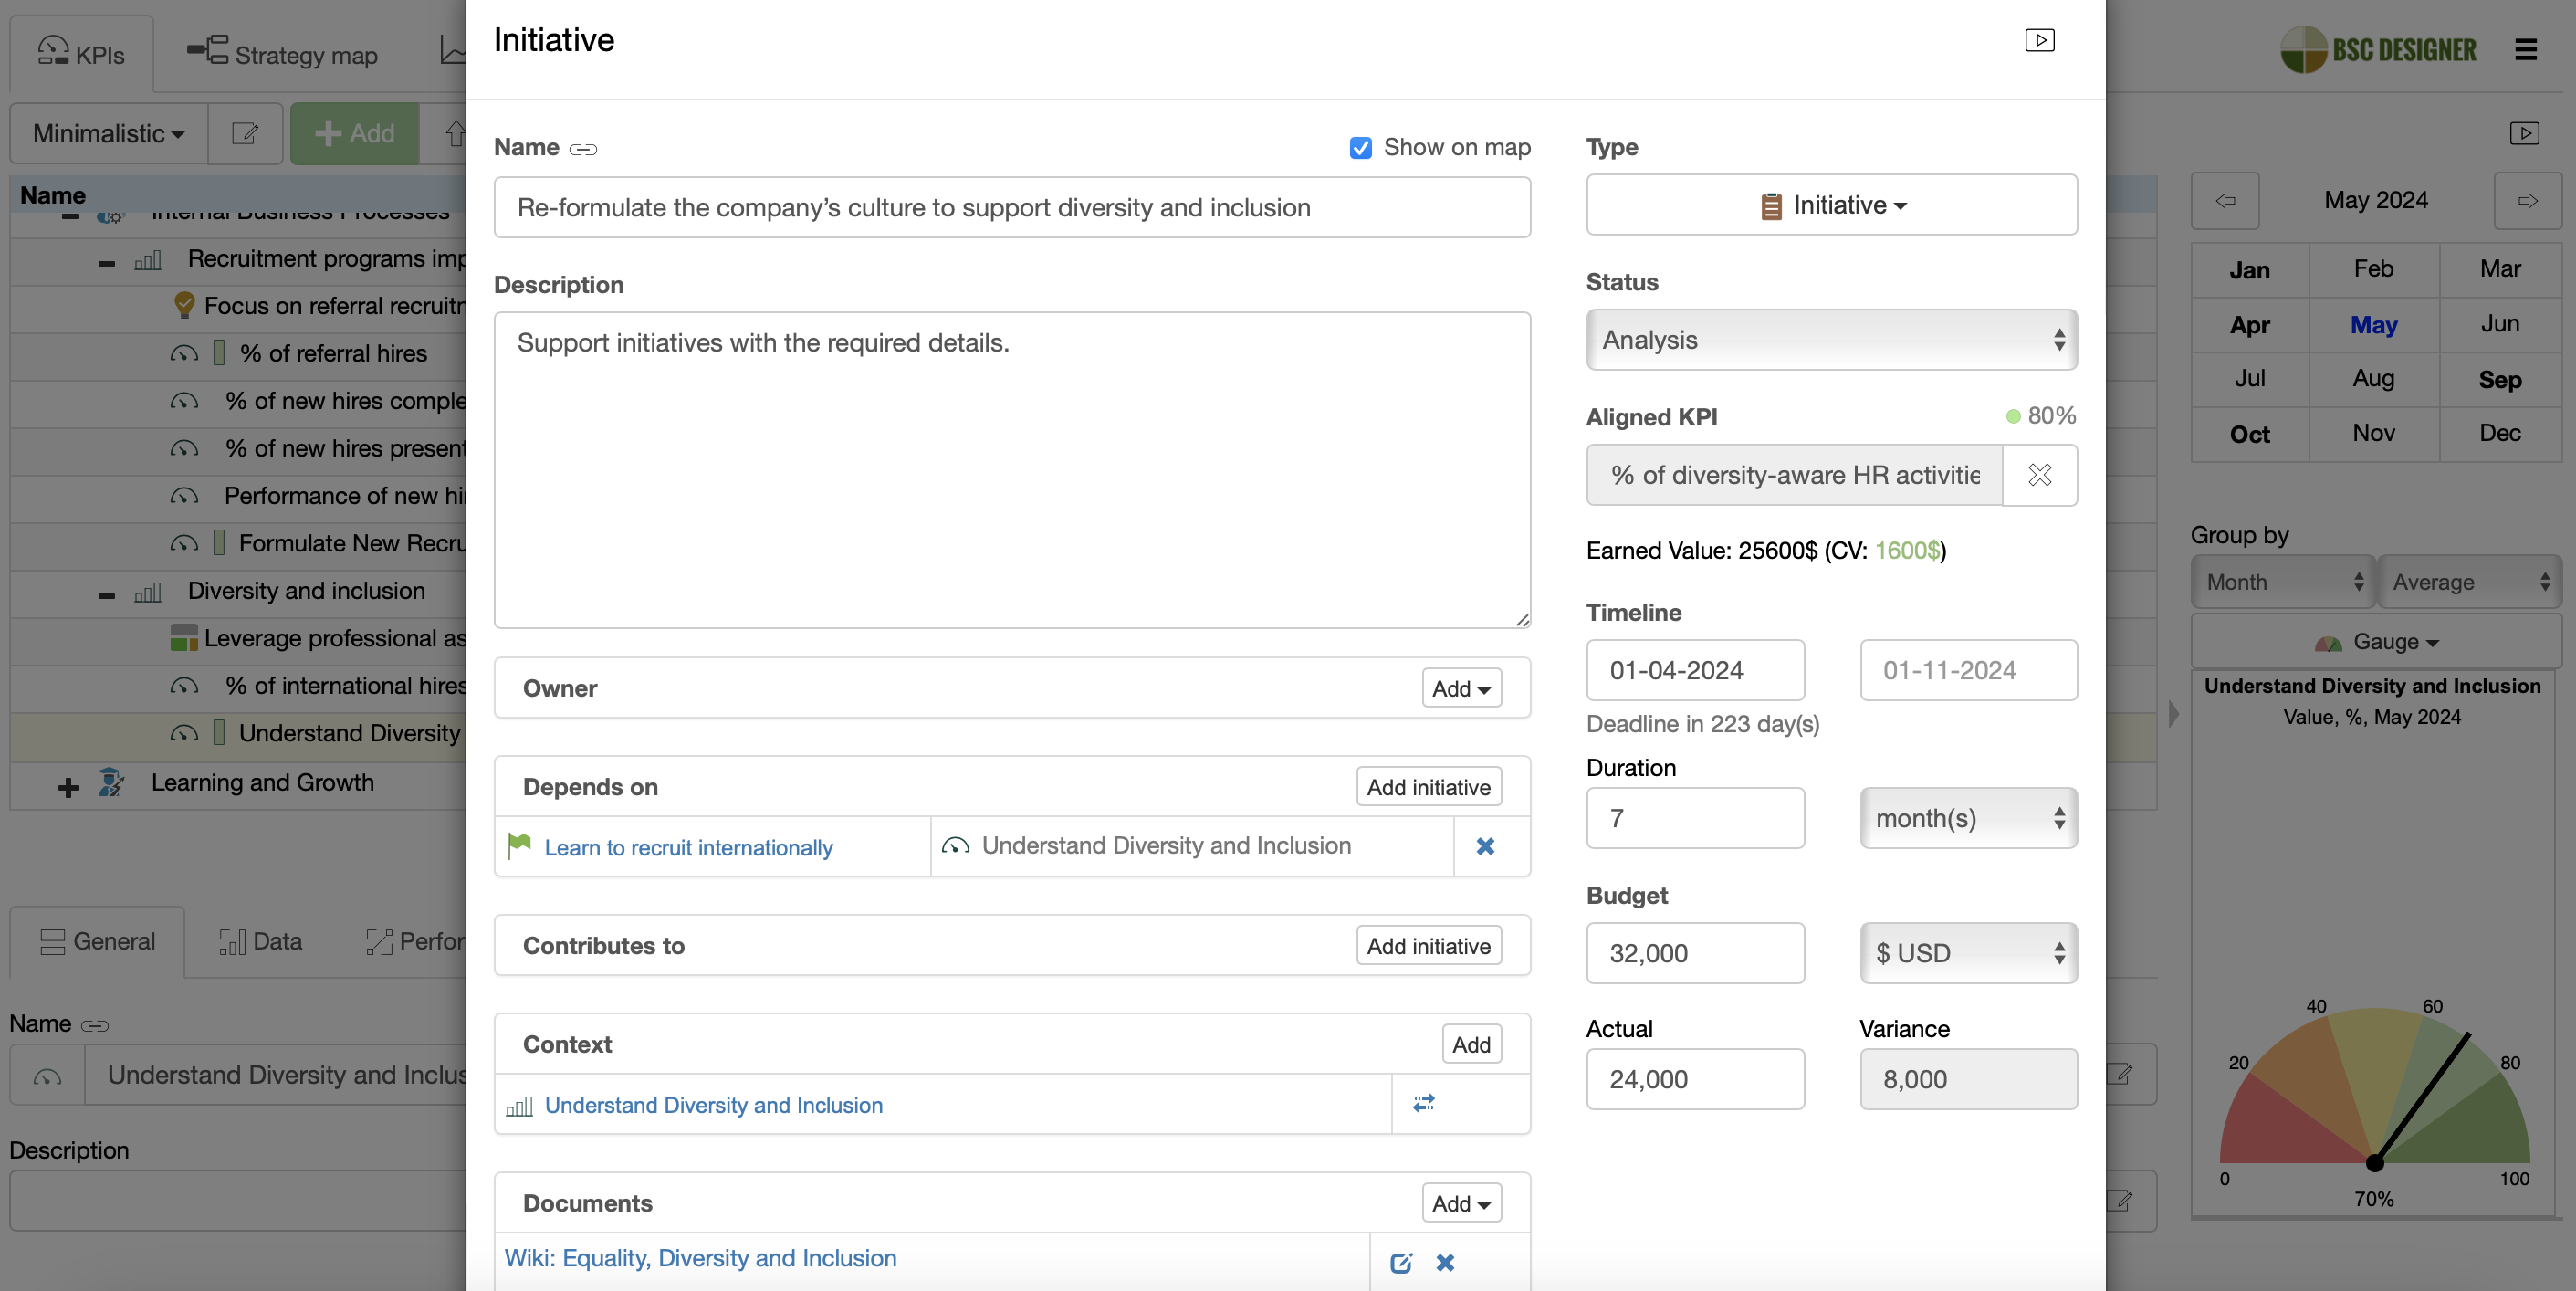
Have Specific Action Plans to Execute Your Strategy
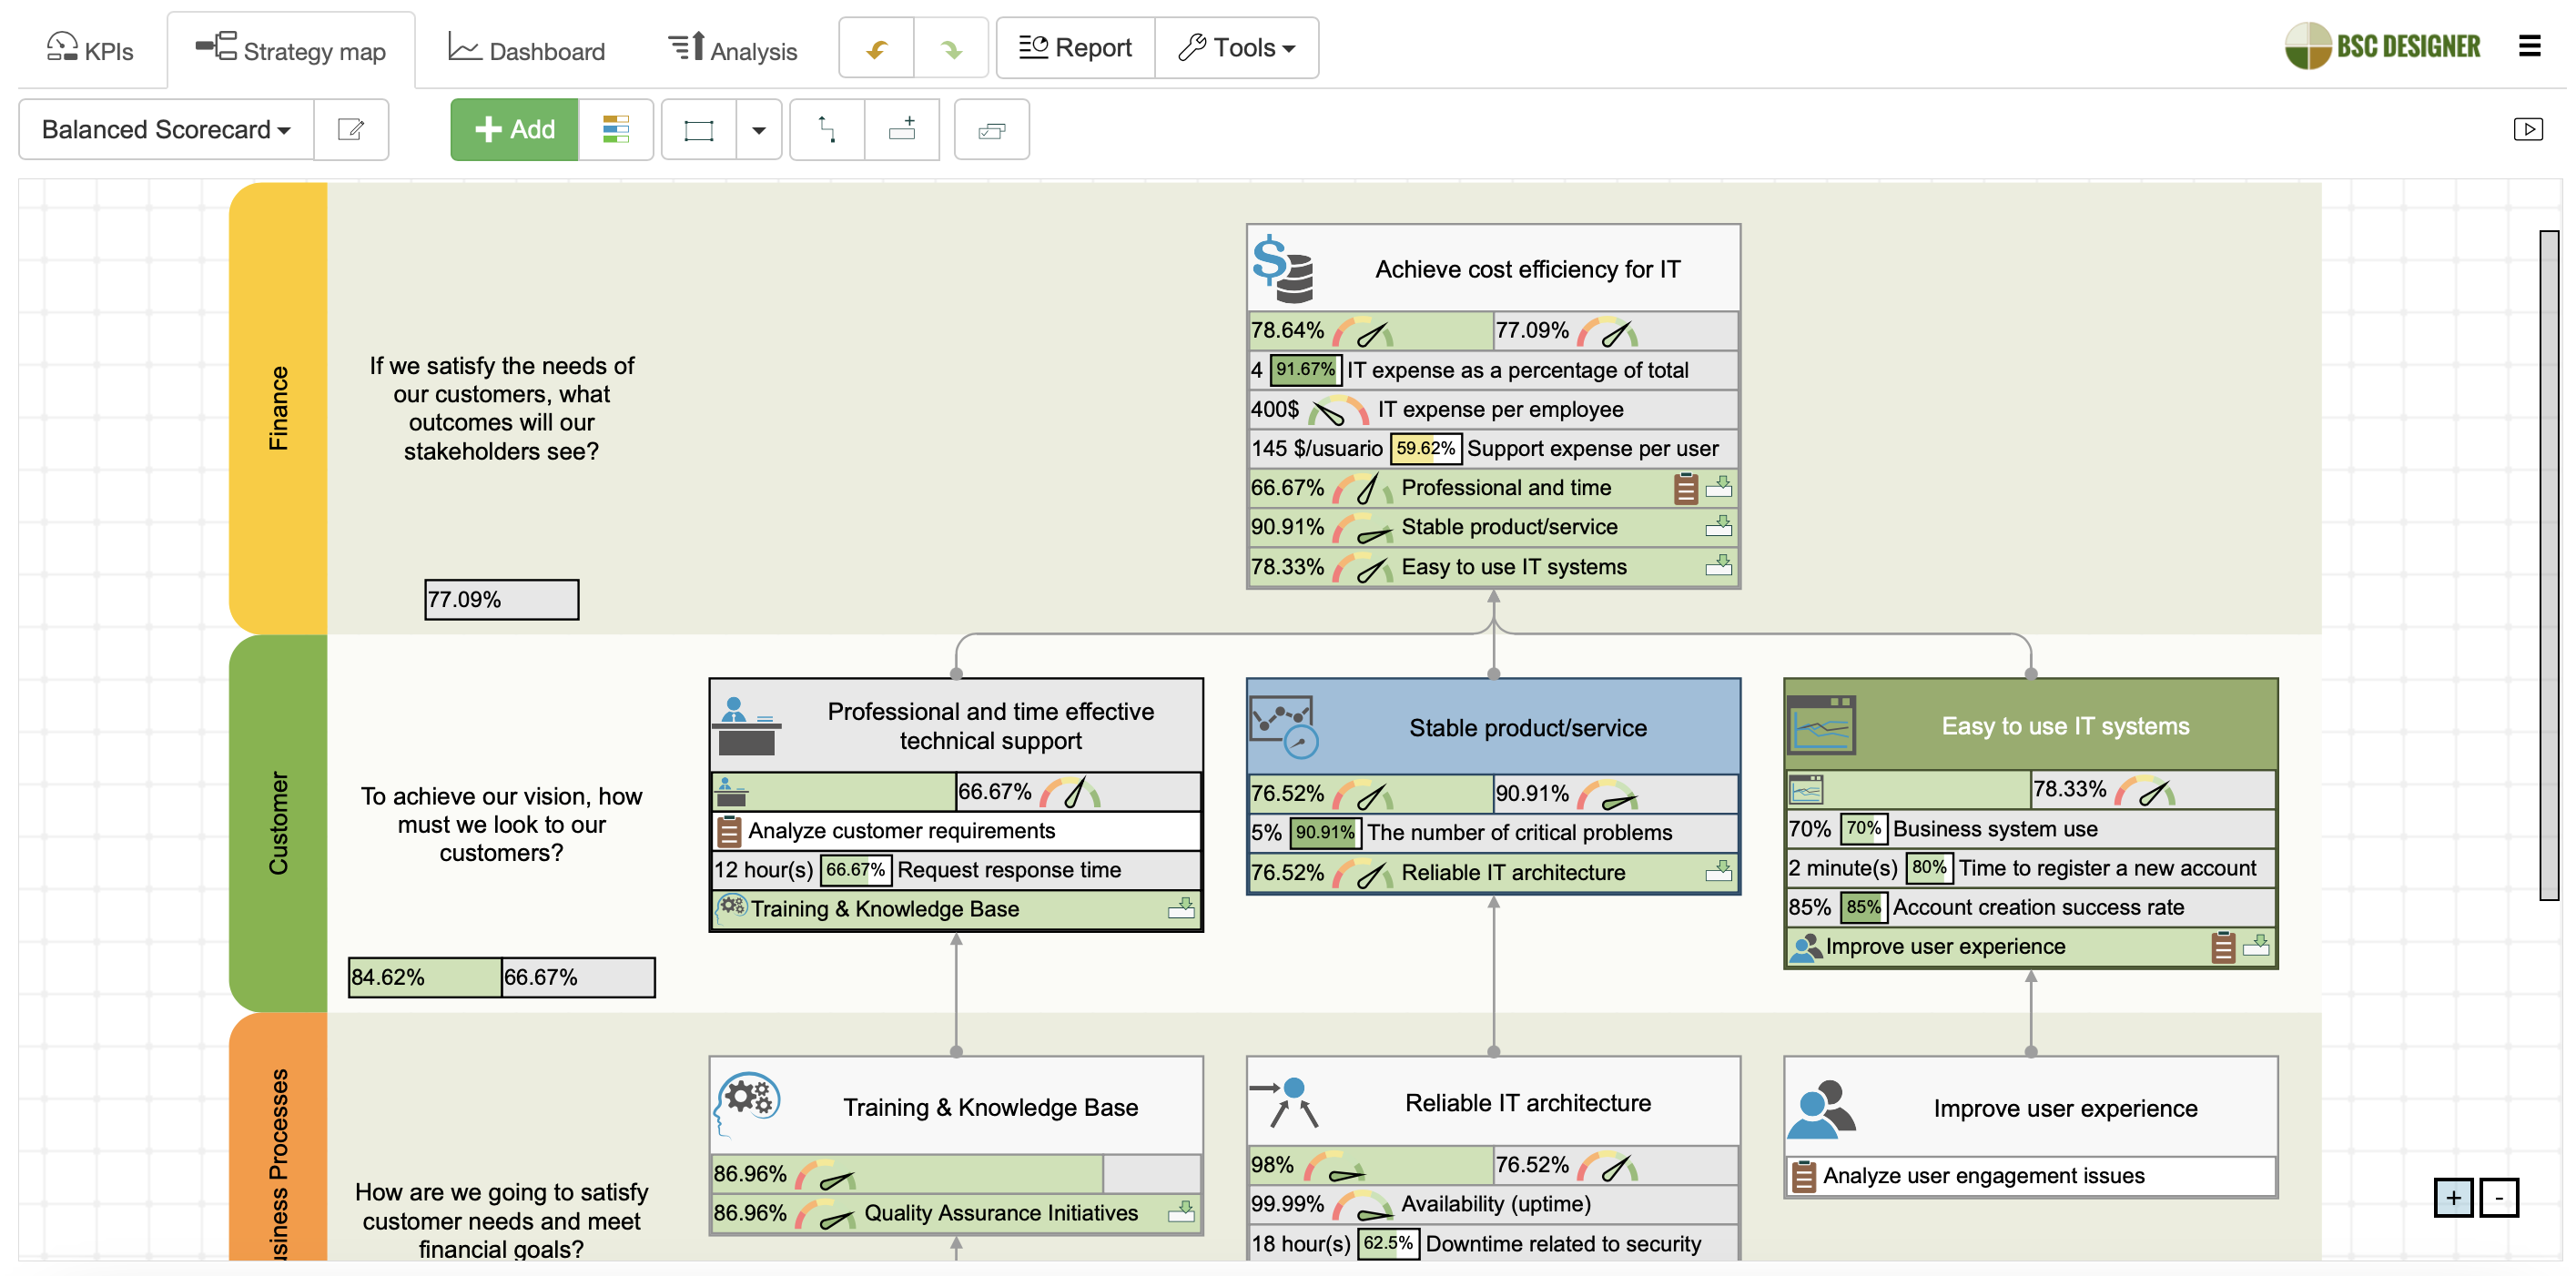
Create Strategy Maps Automatically
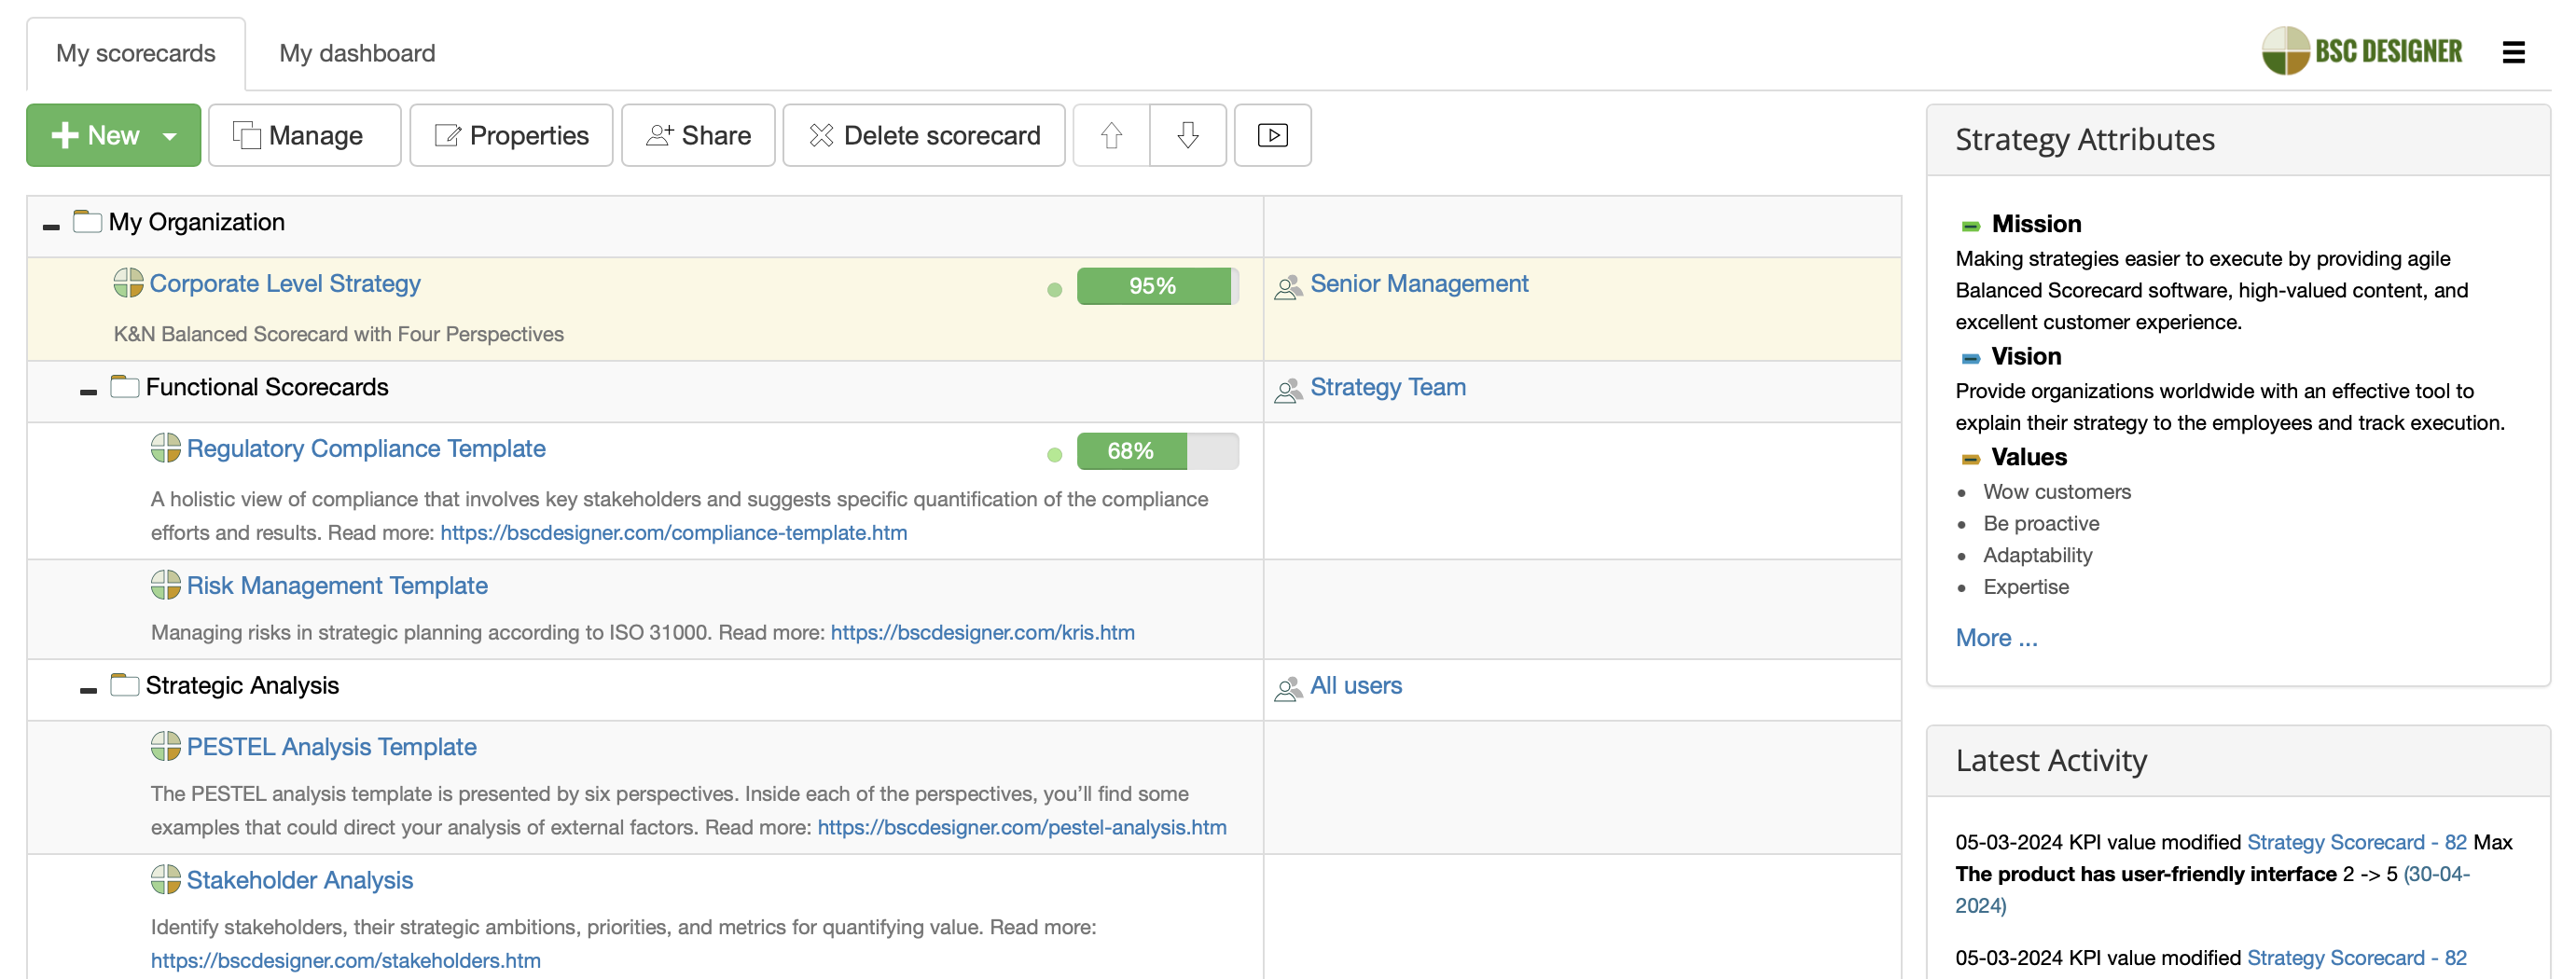
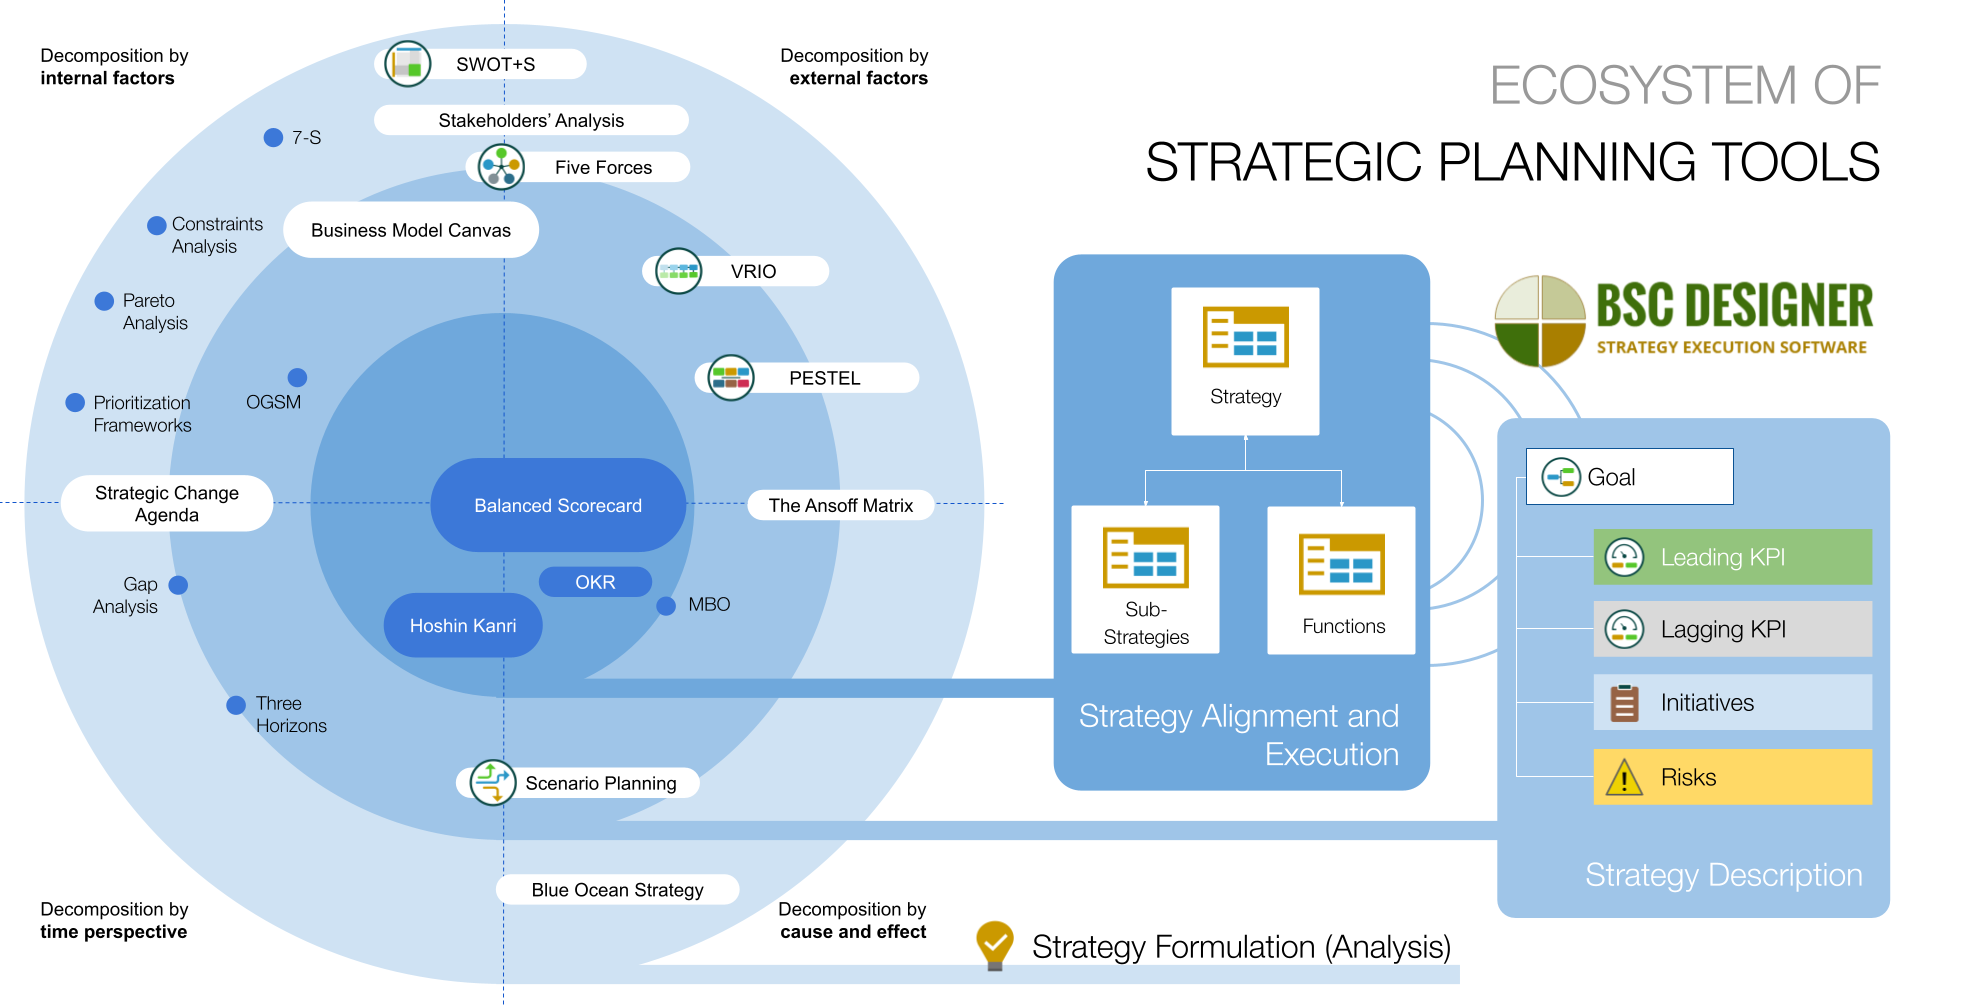
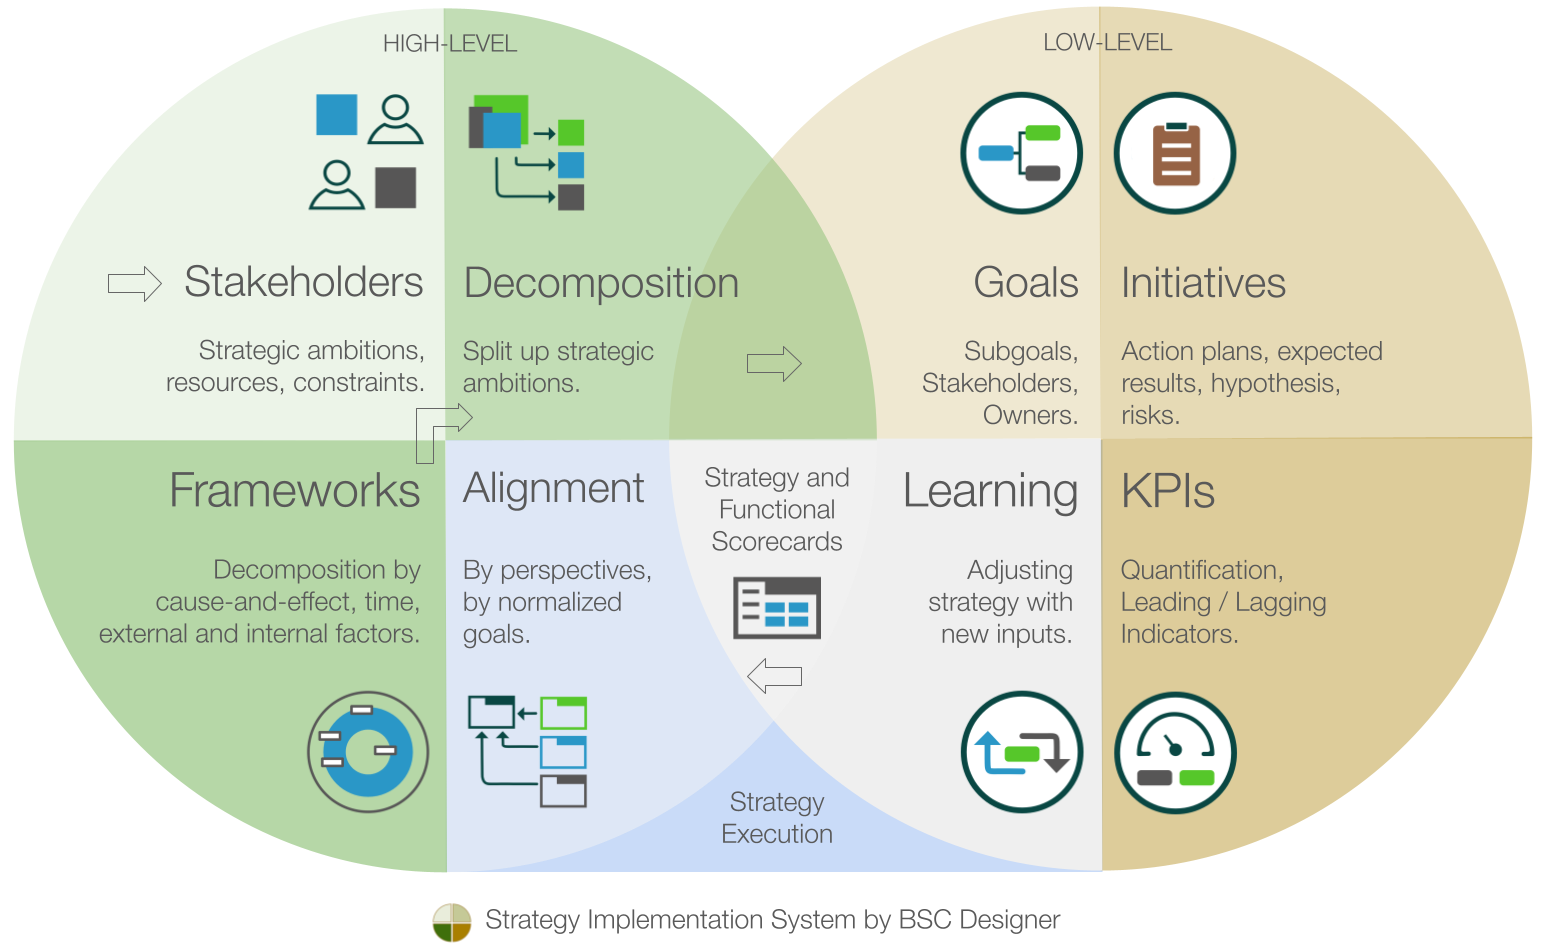
Combine Business Frameworks and Strategy Scorecard Templates
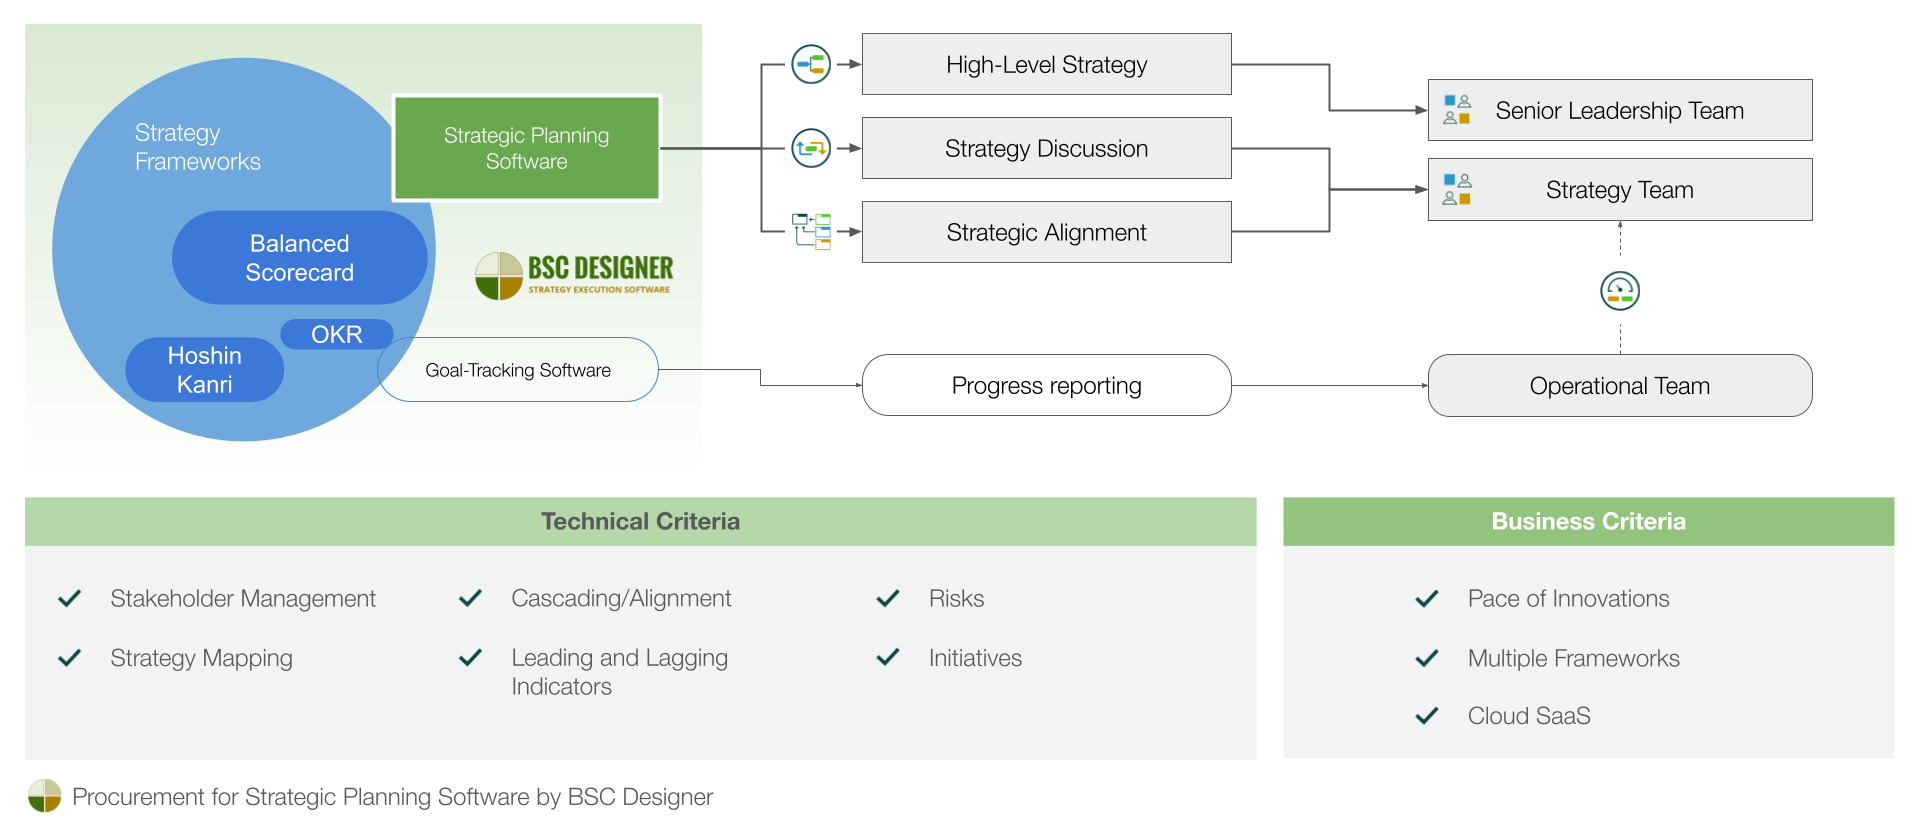
Align the results of various business frameworks in a single strategy workspace; use the built-in templates for different business challenges.
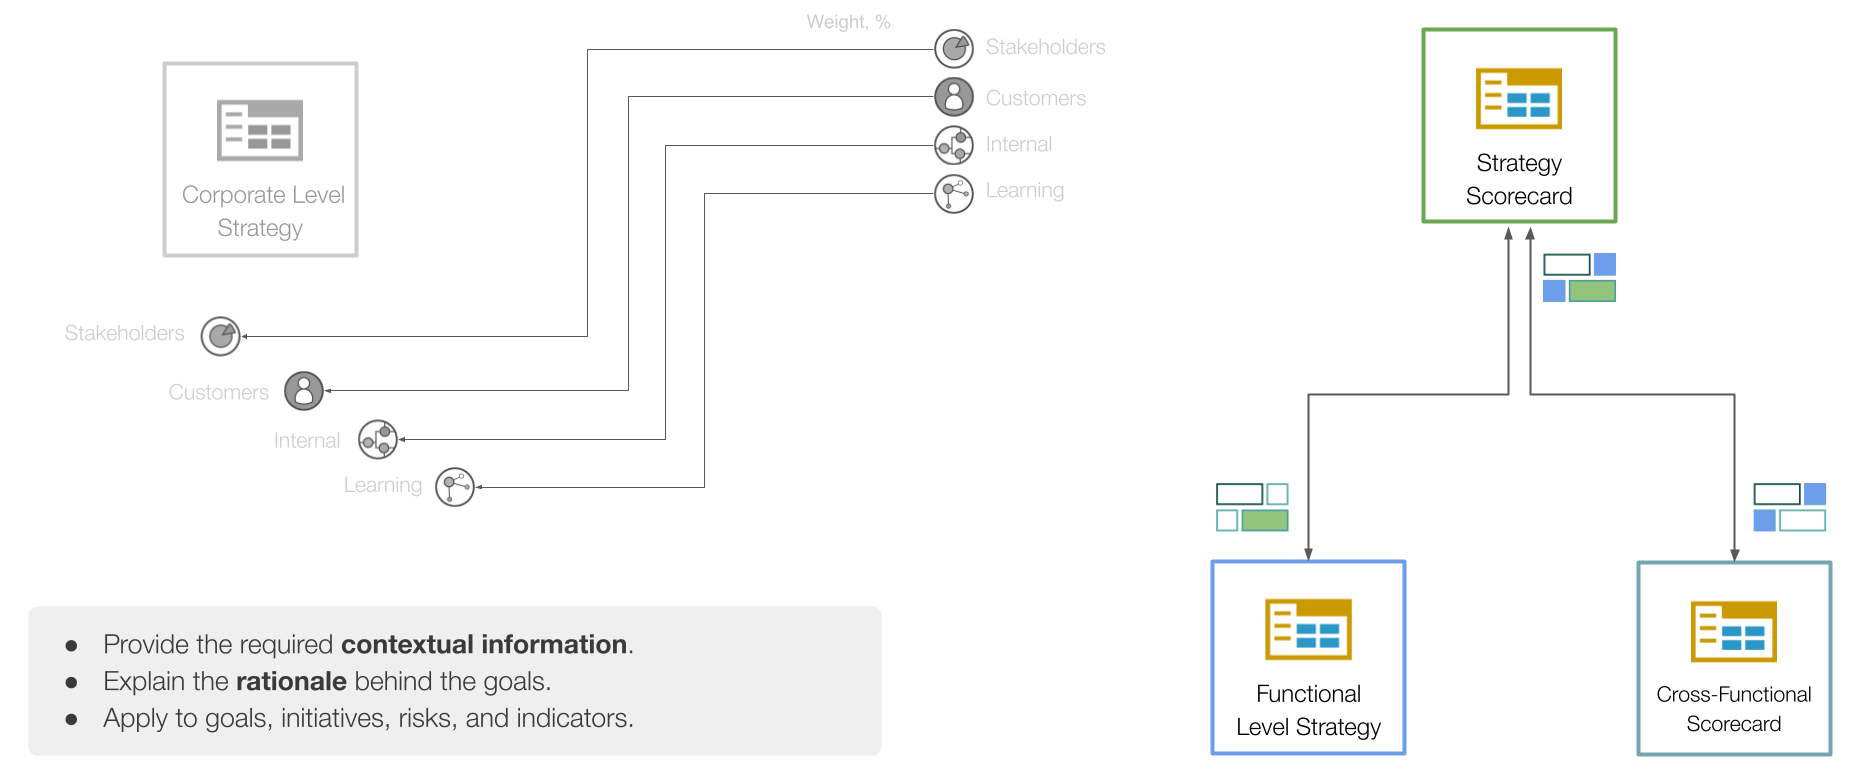
Align Scorecards Around Common Strategy
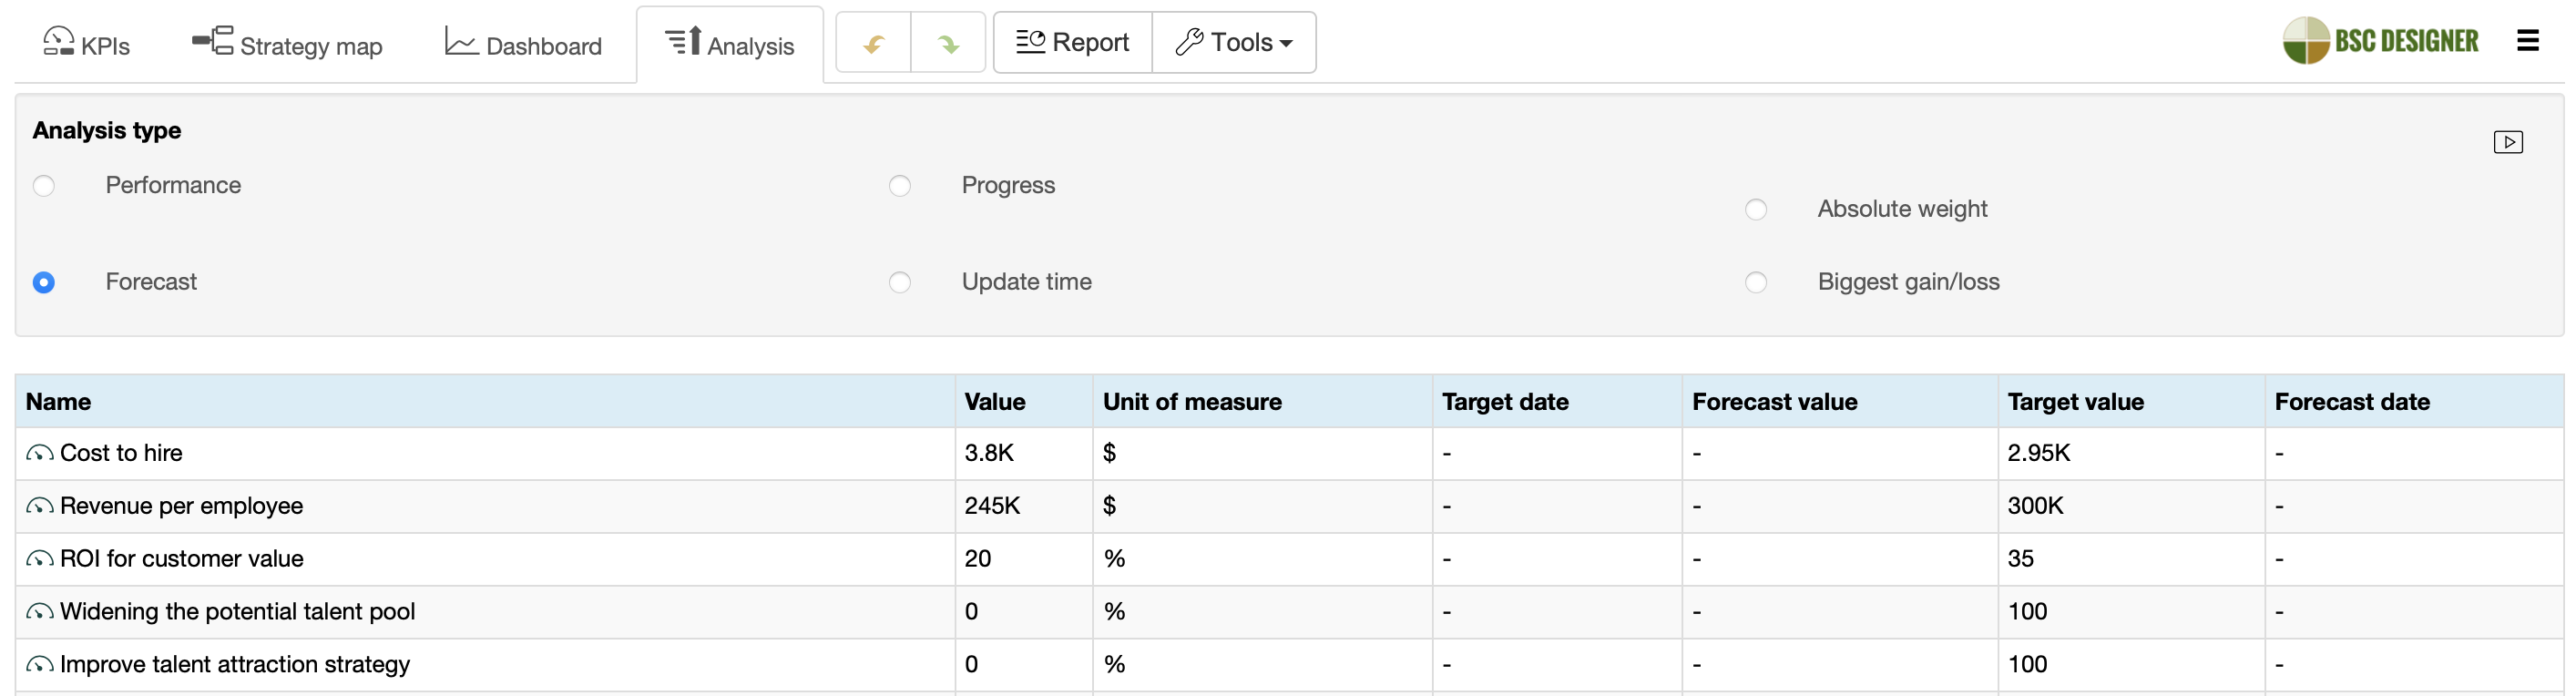
Find Performance Gaps, Predict Trends
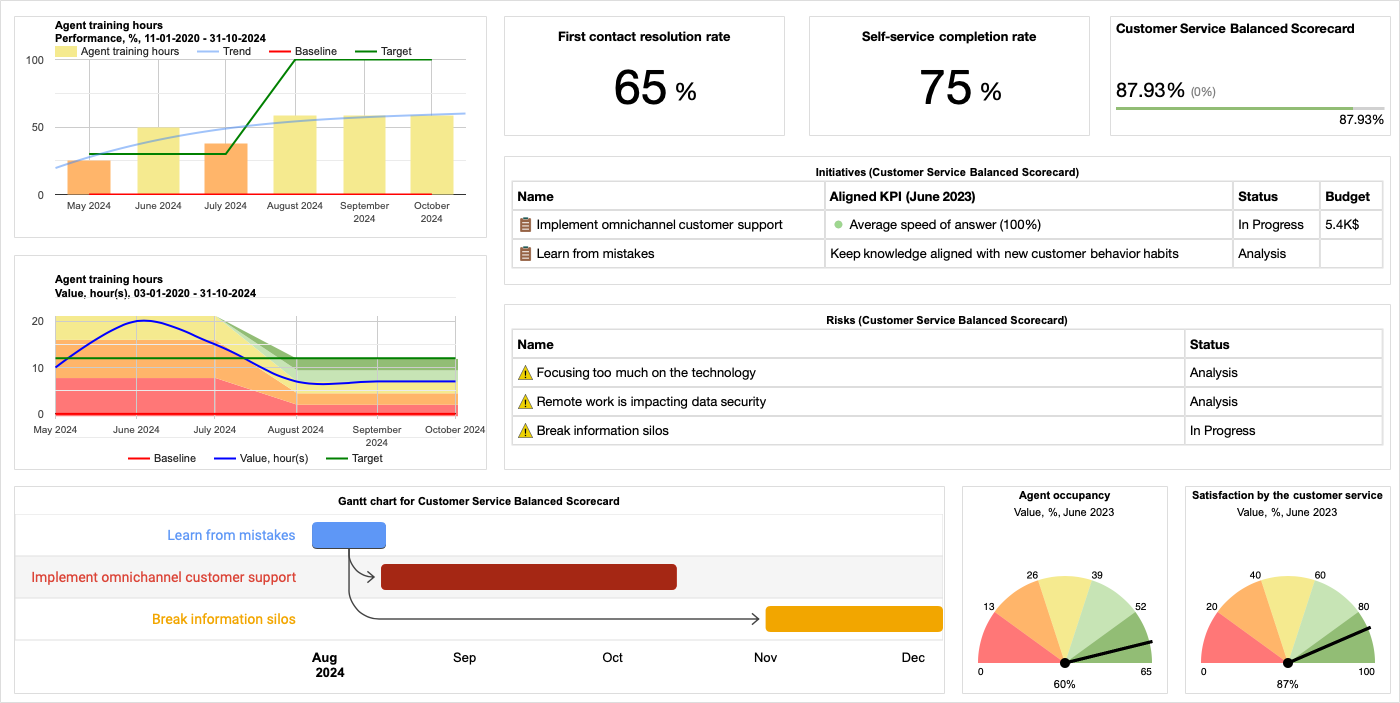
Make Faster Decisions with BI Dashboards
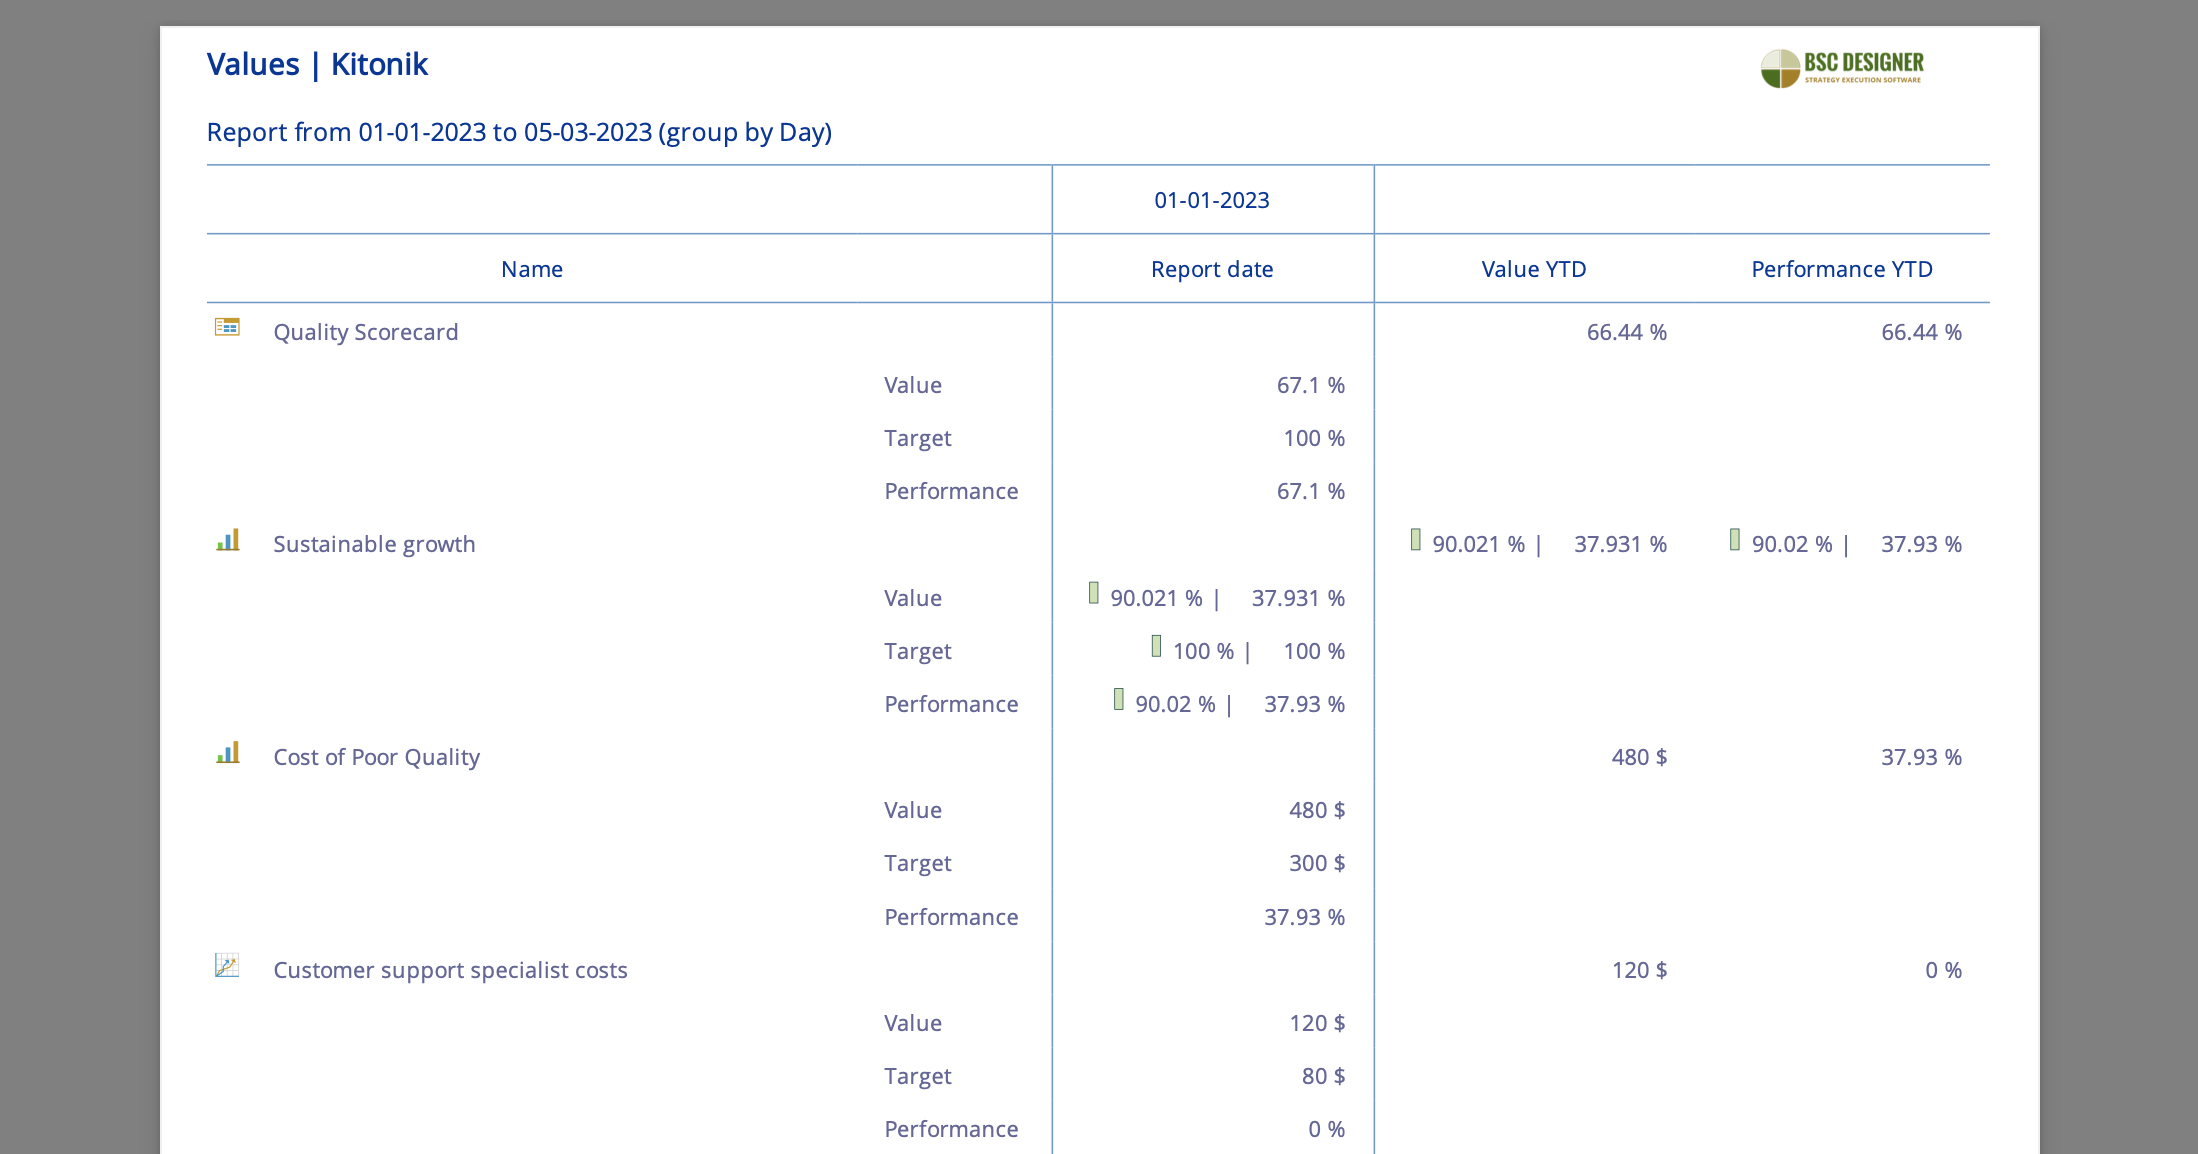
Keep Stakeholders Informed with Performance Reports
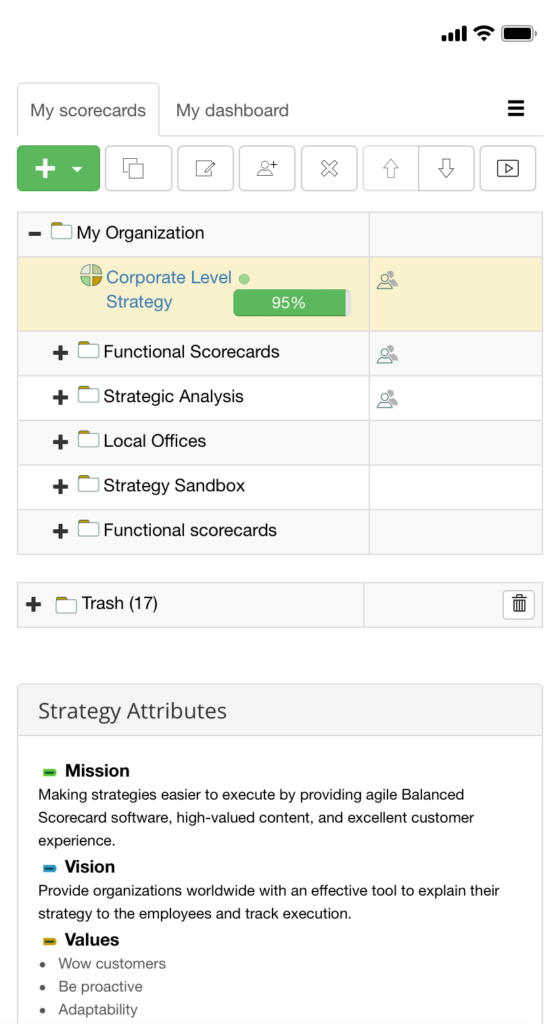
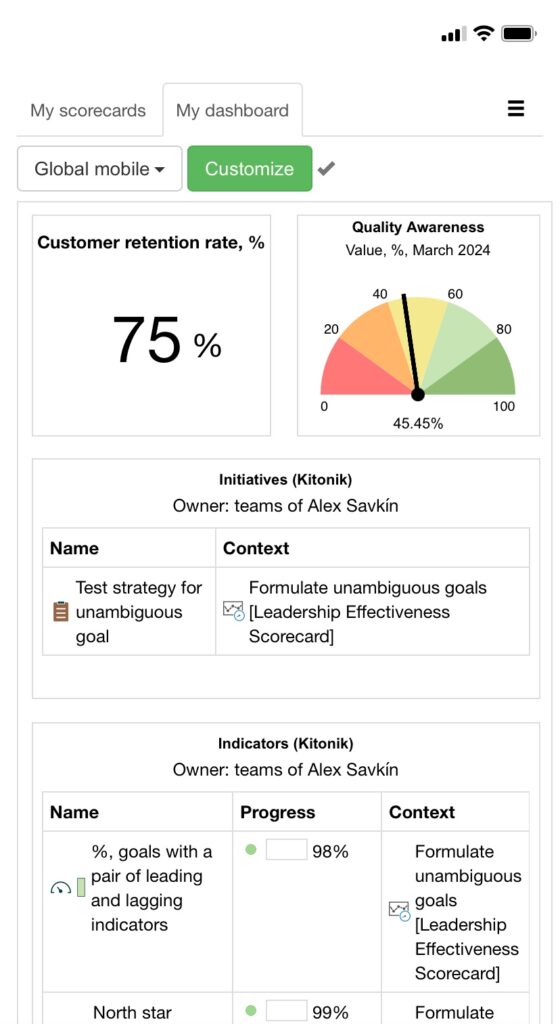
Your Strategies on the Smartphone
Data Governance
(for scorecards, indicators, dashboards) |
(AICPA SOC 2 Type II, SOC 3 Type II, ISO 27001, PCI-DSS) |
Companies Across the Globe Trust BSC Designer
We find BSC Designer a very ergonomic and intuitive tool. It quickly adapts to your way to carry out the information analysis. It is simple, fast and effective.
BSC Designer helps to avoid using and maintaining home-made Excel sheets and produces professional results. Learn more >
This tool has contributed a lot as a strategic planning and operation management solution that enabled everyone to track results at real-time and achieve assigned goals.
It provides a dynamic approach to work-flow planning unlike using Excel spreadsheet. Learn more >
We have a very good experience with BSC Designer, as this instrument can facilitate the implementation of the Balanced Scorecard in our unit.
We have been trying to design a MS Excel spreadsheet but this approach proved to be more difficult. Learn more >
We use BSC Designer for measuring performance rather than effort.
BSC Designer has allowed us to evaluate results in more than one way. Now we can reward efforts that we are sure are creating the desired results. Learn more >
I was looking for a software for strategical planning for the company where I work, therefore we are looking for a way to implement the Balanced Scorecard.
I found BSC Designer, which is a very practical software. Learn more >
A great and practical option to deliver and keep a Balanced Scorecard.
We are a consulting firm and use BSC-Designer regularly to help our clients to visualize their strategy and keep control of their vital metrics. Learn more >
Key Features of BSC Designer Software
Learn more >
Learn more >
Learn more >
Learn more >
Learn more >
Learn more >
Free plan for small projects. No credit card required.
This Balanced Scorecard software comes with 31 ready-to-use scorecard templates.
![]() Present the BSC Designer to key stakeholders involved in strategic planning.
Present the BSC Designer to key stakeholders involved in strategic planning.
A System to Connect the Dots
Procurement for Strategic Planning Software