As an experiment, we’ll describe the same strategy using the Hoshin Kanri and the Balanced Scorecard frameworks to see the advantages and the limitations of both business tools.
Both Hoshin Kanri and the Balanced Scorecard are strategic planning frameworks. In this article, we’ll review the Hoshin Kanri framework briefly, and as an experiment will describe a strategy of an imaginary company using these two frameworks.
The key topics of the article:
- Hoshin Kanri – introduction. Plan-Do-Check-Act; The Catchball; X-Matrix
- Strategy deployment experiment. Strategy described with Hoshin Kanri and the Balanced Scorecard
- Advantages and disadvantages of Hoshin Kanri
Introduction to the Hoshin Kanri
Hoshin Kanri framework is not a mainstream, it is not as popular as other “lean” tools, and it is not that promoted in the form of workshops/certifications/books as is the Balanced Scorecard. Still, I believe some of its ideas can be employed by any western executives.
Japanese words “Hoshin” and “Kanri” literally mean “a method for strategic direction setting” and “management/control.” It was popularized in Japan in the 1950s by Professor Yoji Akao. The website of his colleague Karen Roberts is one of the starting points to learn about the Hoshin Kanri method.
- It was widely used by Toyota and claimed by many business authors to be a reason for Toyota’s success.
- In the Western world, Hewlett Packard played a significant role in the fame of Hoshin Kanri.
There is no 100% agreement on elements and the processes of Hoshin Kanri; many schools and practitioners teach it in a different way. Needless to say, we see the same uncertainty with other business tools.
What Hoshin Kanri is All About
When researching the Hoshin Kanri framework, I often had a feeling that I had heard this before. The reason is that many authors are trying to pack Hoshin Kanri’s ideas into a new shiny box that just arrived from Japan and claim that this method contains unlimited business wisdom, while, in essence, the Hoshin Kanri is about these four components:
- Plan-Do-Check-Act implemented into the DNA of the framework
- Catchball, a term used to underline the importance of the discussion between stakeholders
- X Matrix – a Hoshin Kanri´s strategy map
Download Hoshin Kanri PDF Template
Plan-Do-Check-Act
What’s special about the PDCA (Plan-Do-Check-Act) cycle? We all do it!
The real difference is that according to Hoshin Kanri, one needs to implement PDCA consciously and systematically into all of the smallest (action level) and biggest (strategy level) activities of the business.
For example:
- I’m writing an article, and instead of just relying on intuition, I suppose to plan a/b test and get back with the results that prove what title works better for my audience.
- A company implemented omnichannel customer support to make it easier for the users from social media to contact support staff. Instead of taking the results of such implementation as granted, in the Hoshin Kanri paradigm, the company will continue tracking response time to see if the improvement actually worked.
Again, nothing new in this approach, but making it something more systematic and disciplined is always a good idea.
The Catchball
The Catchball is a term used in Hoshin Kanri for strategy discussion and alignment. Why invent a new term? To underline the discussion nature of the process.
- It is not 100% top-down. Top managers don’t just articulate and translate their vision, goals, and objectives – some goals are suggested by the employees.
- It is more about discussion and brainstorming, analyzing and testing options, and getting back to the discussion (PDCA cycle, again!)
- It is about alignment. The ultimate goal of the “catchball” process is not to define a perfect set of objectives but to find the way how these objectives can be measured, and more importantly, how they can be aligned with specific actions.
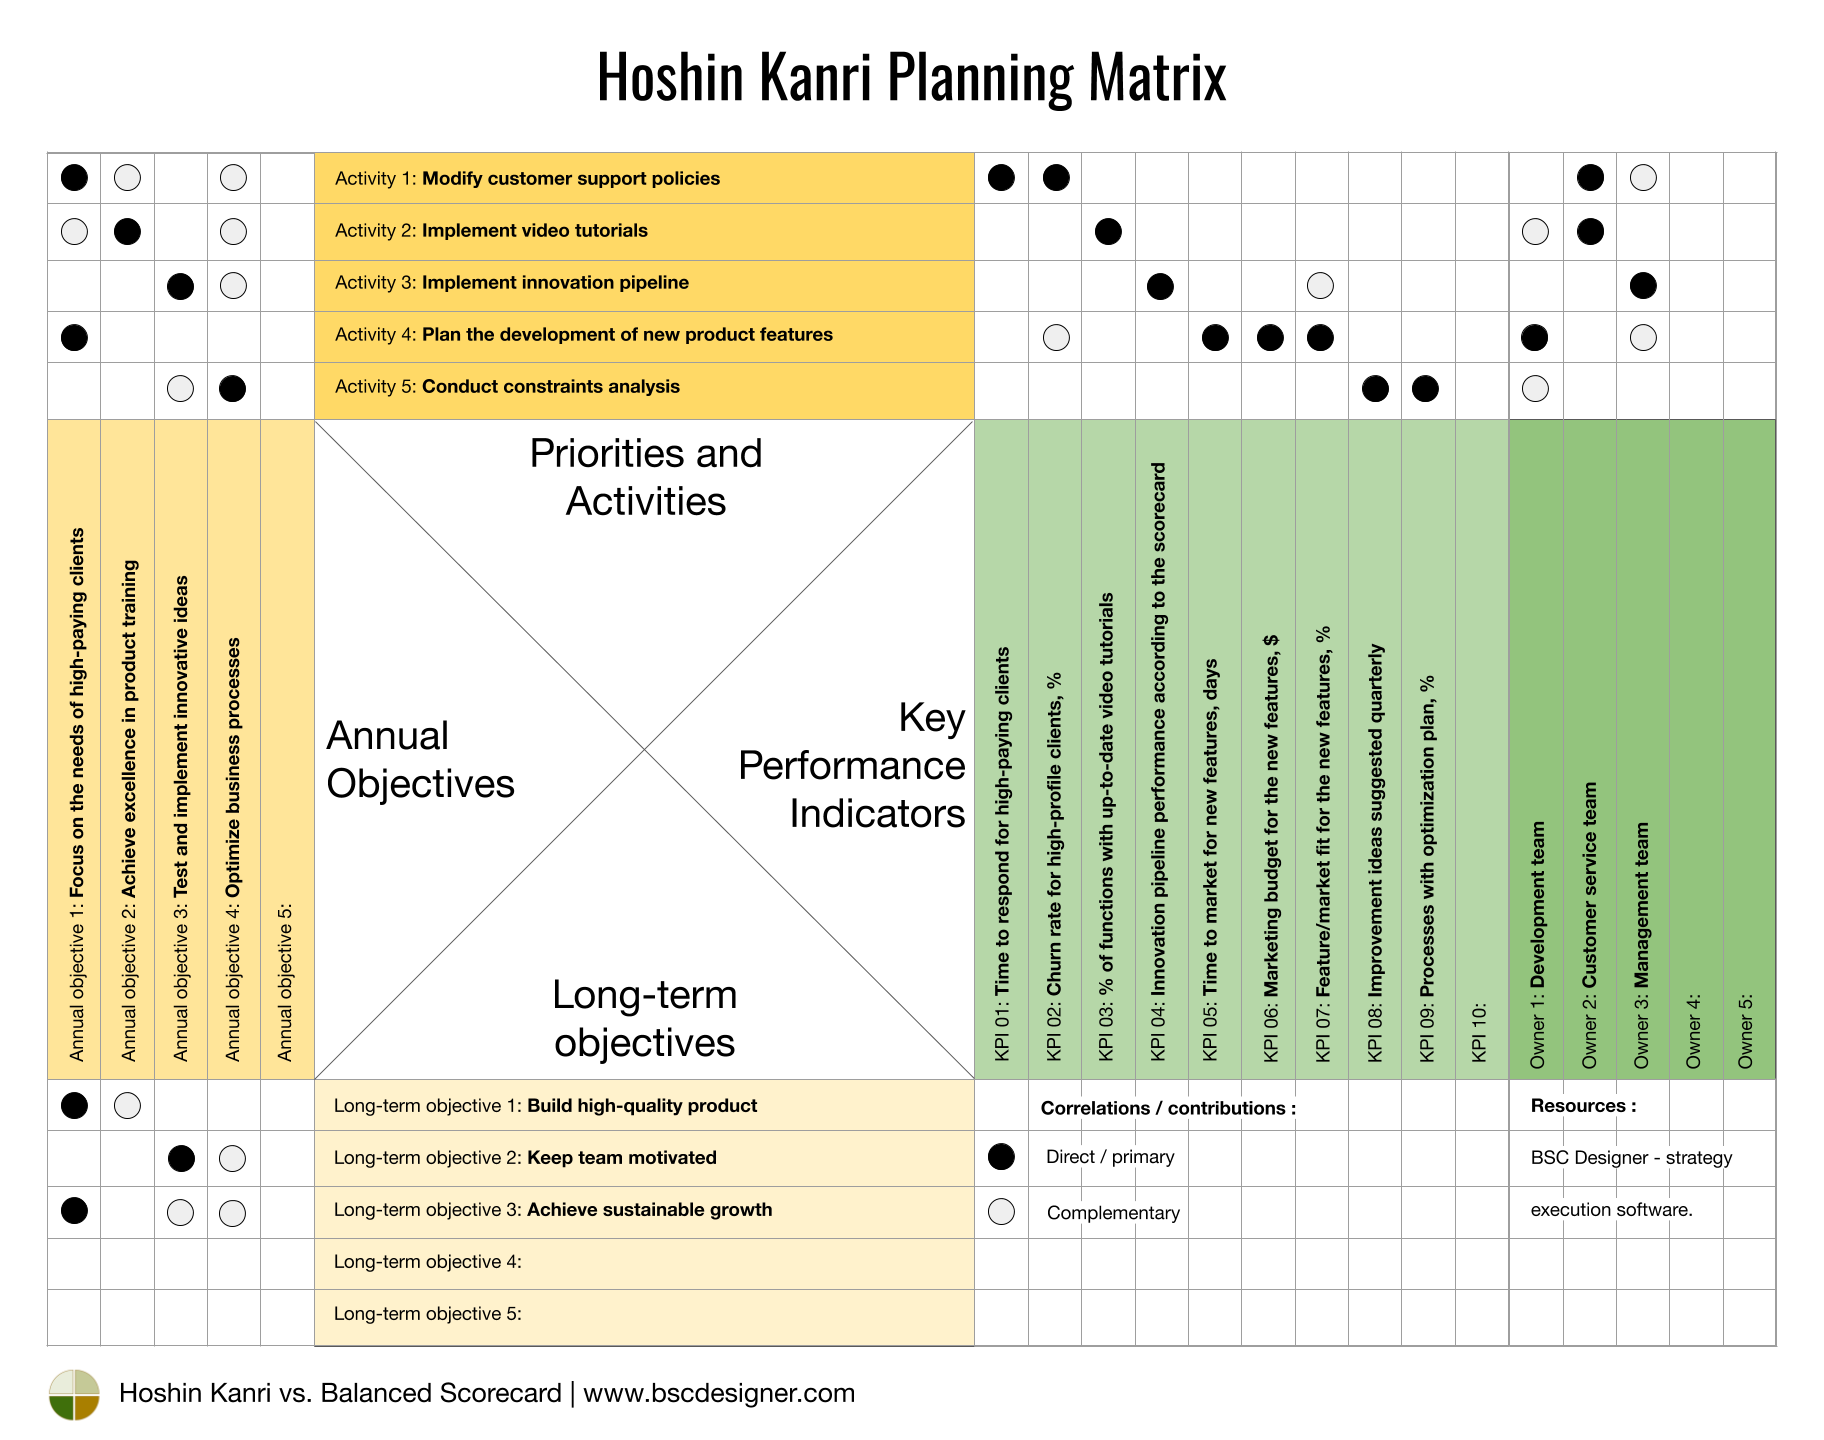
Hoshin Kanri X-Matrix
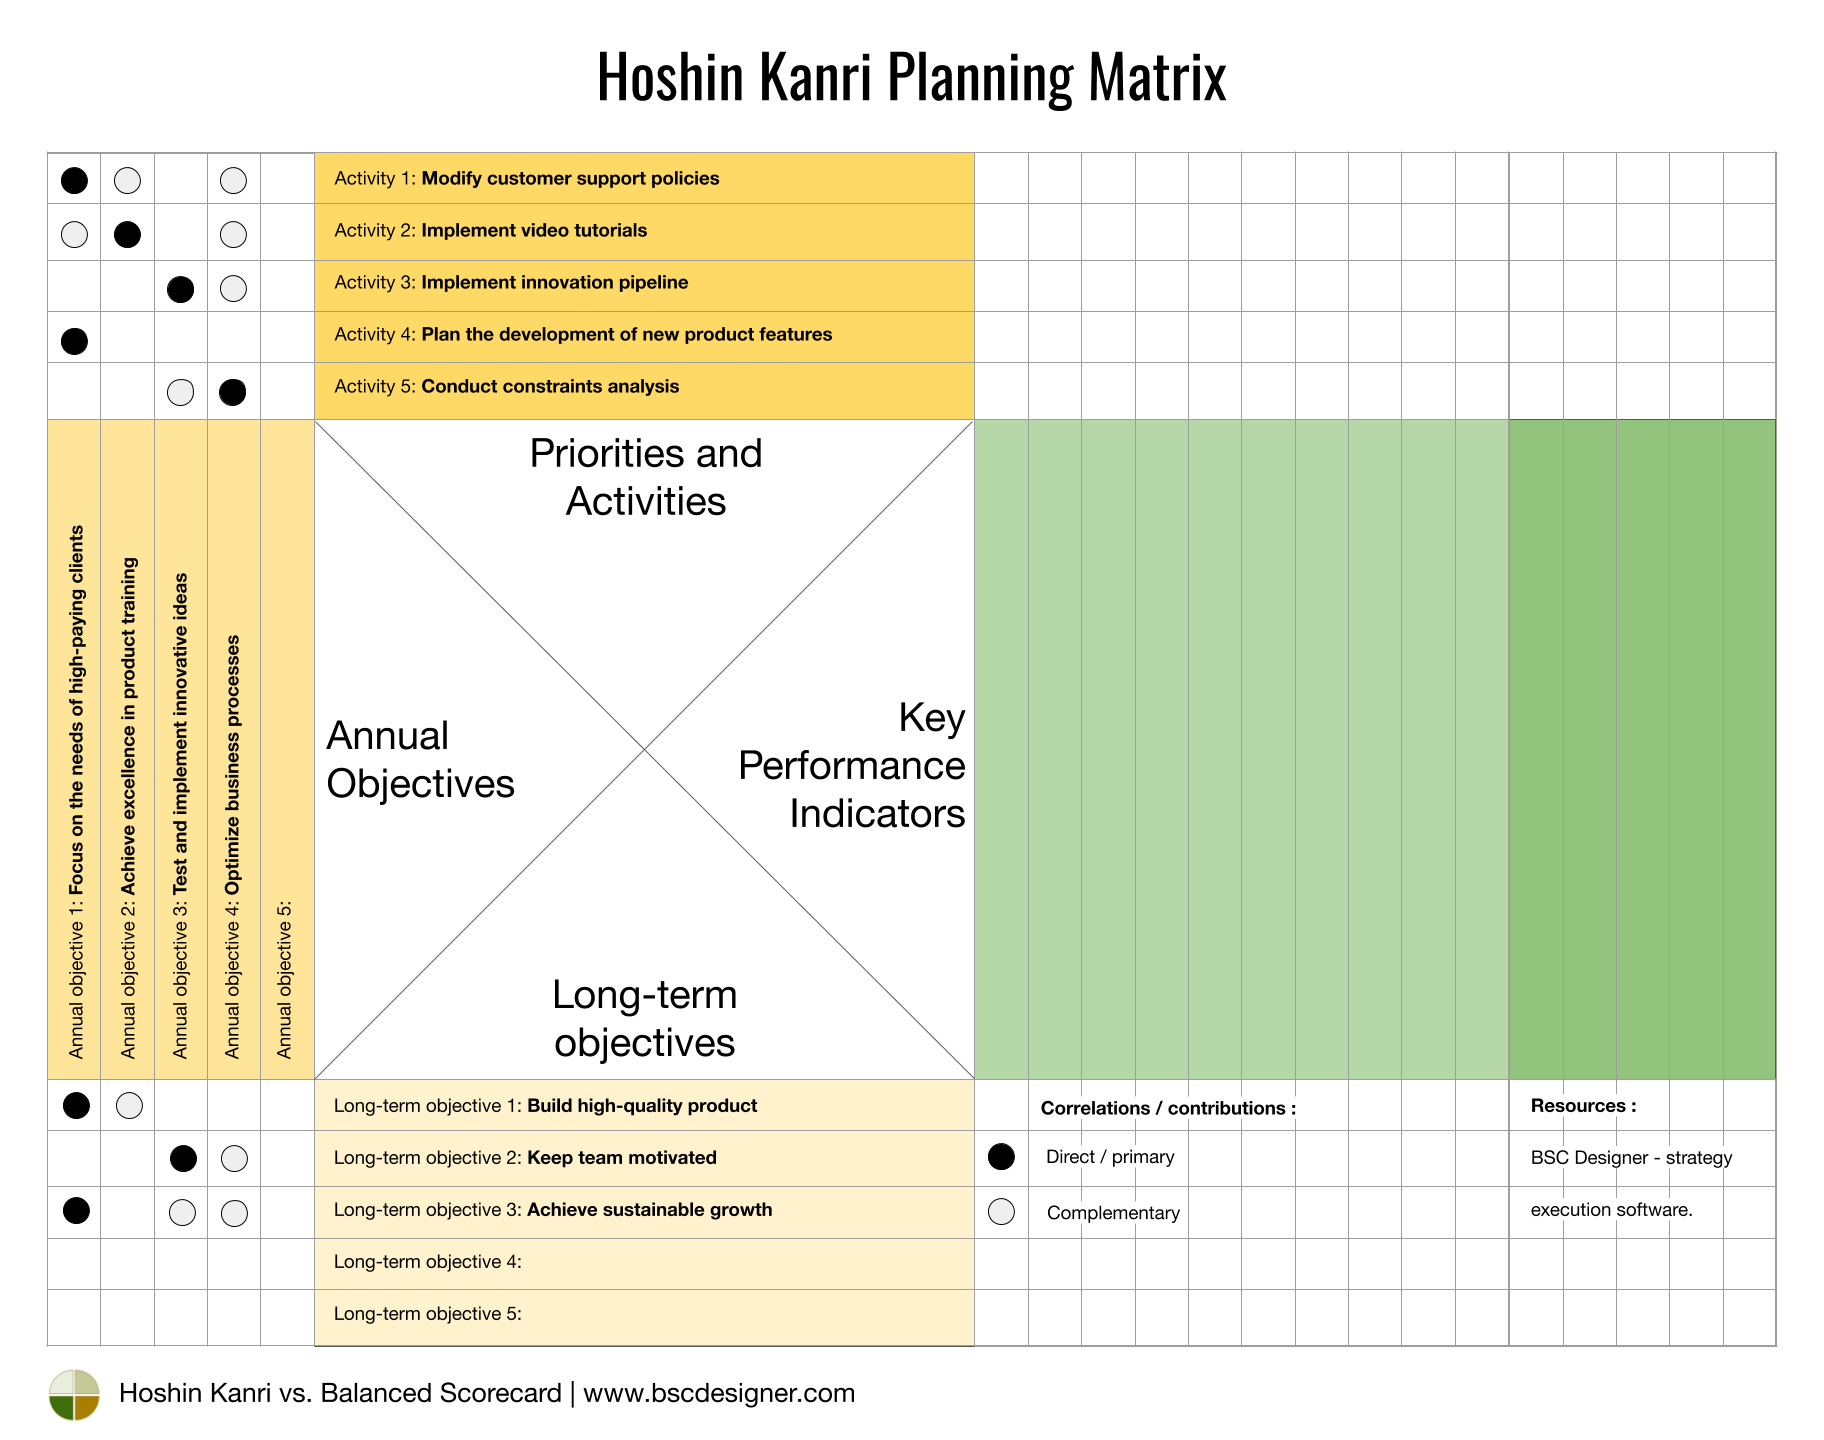
Have a look at the Hoshin Kanri Matrix. For the first time, it might look confusing, but there is a clear logic in how it is created:
- The sectors of the matrix correspond to the different levels abstraction in strategic planning.
- We start with strategic priorities or long-term goals, move to the annual goals, activities, and finally, performance metric.
- The X matrix helps to explain the correlation between the closest sectors. The notation for the correlations varies across the companies. In this example, I’ve used black circles for direct correlation and white circles for complementary ideas.
Strategy Deployment Experiment: The Same Strategy Described by Hoshin Kanri and the Balanced Scorecard
Let’s do an experiment and describe a strategy using Hoshin Kanri X-Matrix and later describe the same strategy using the Balanced Scorecard’s strategy map.
Disclaimer:
The experiment is rather subjective. There are strategies that fit better in the Hoshin Kanri paradigm, and, of course, there are things unique to the Balanced Scorecard. The same can be said about strategists who have their own preferences and prefer using the Balanced Scorecard, OKR, MBO, SWOT or Hoshin Kanri as a planning tool.
Describing Strategy with Hoshin Kanri X-Matrix
Let’s pick some simple strategy for this experiment and see if we can learn some lessons along the way.
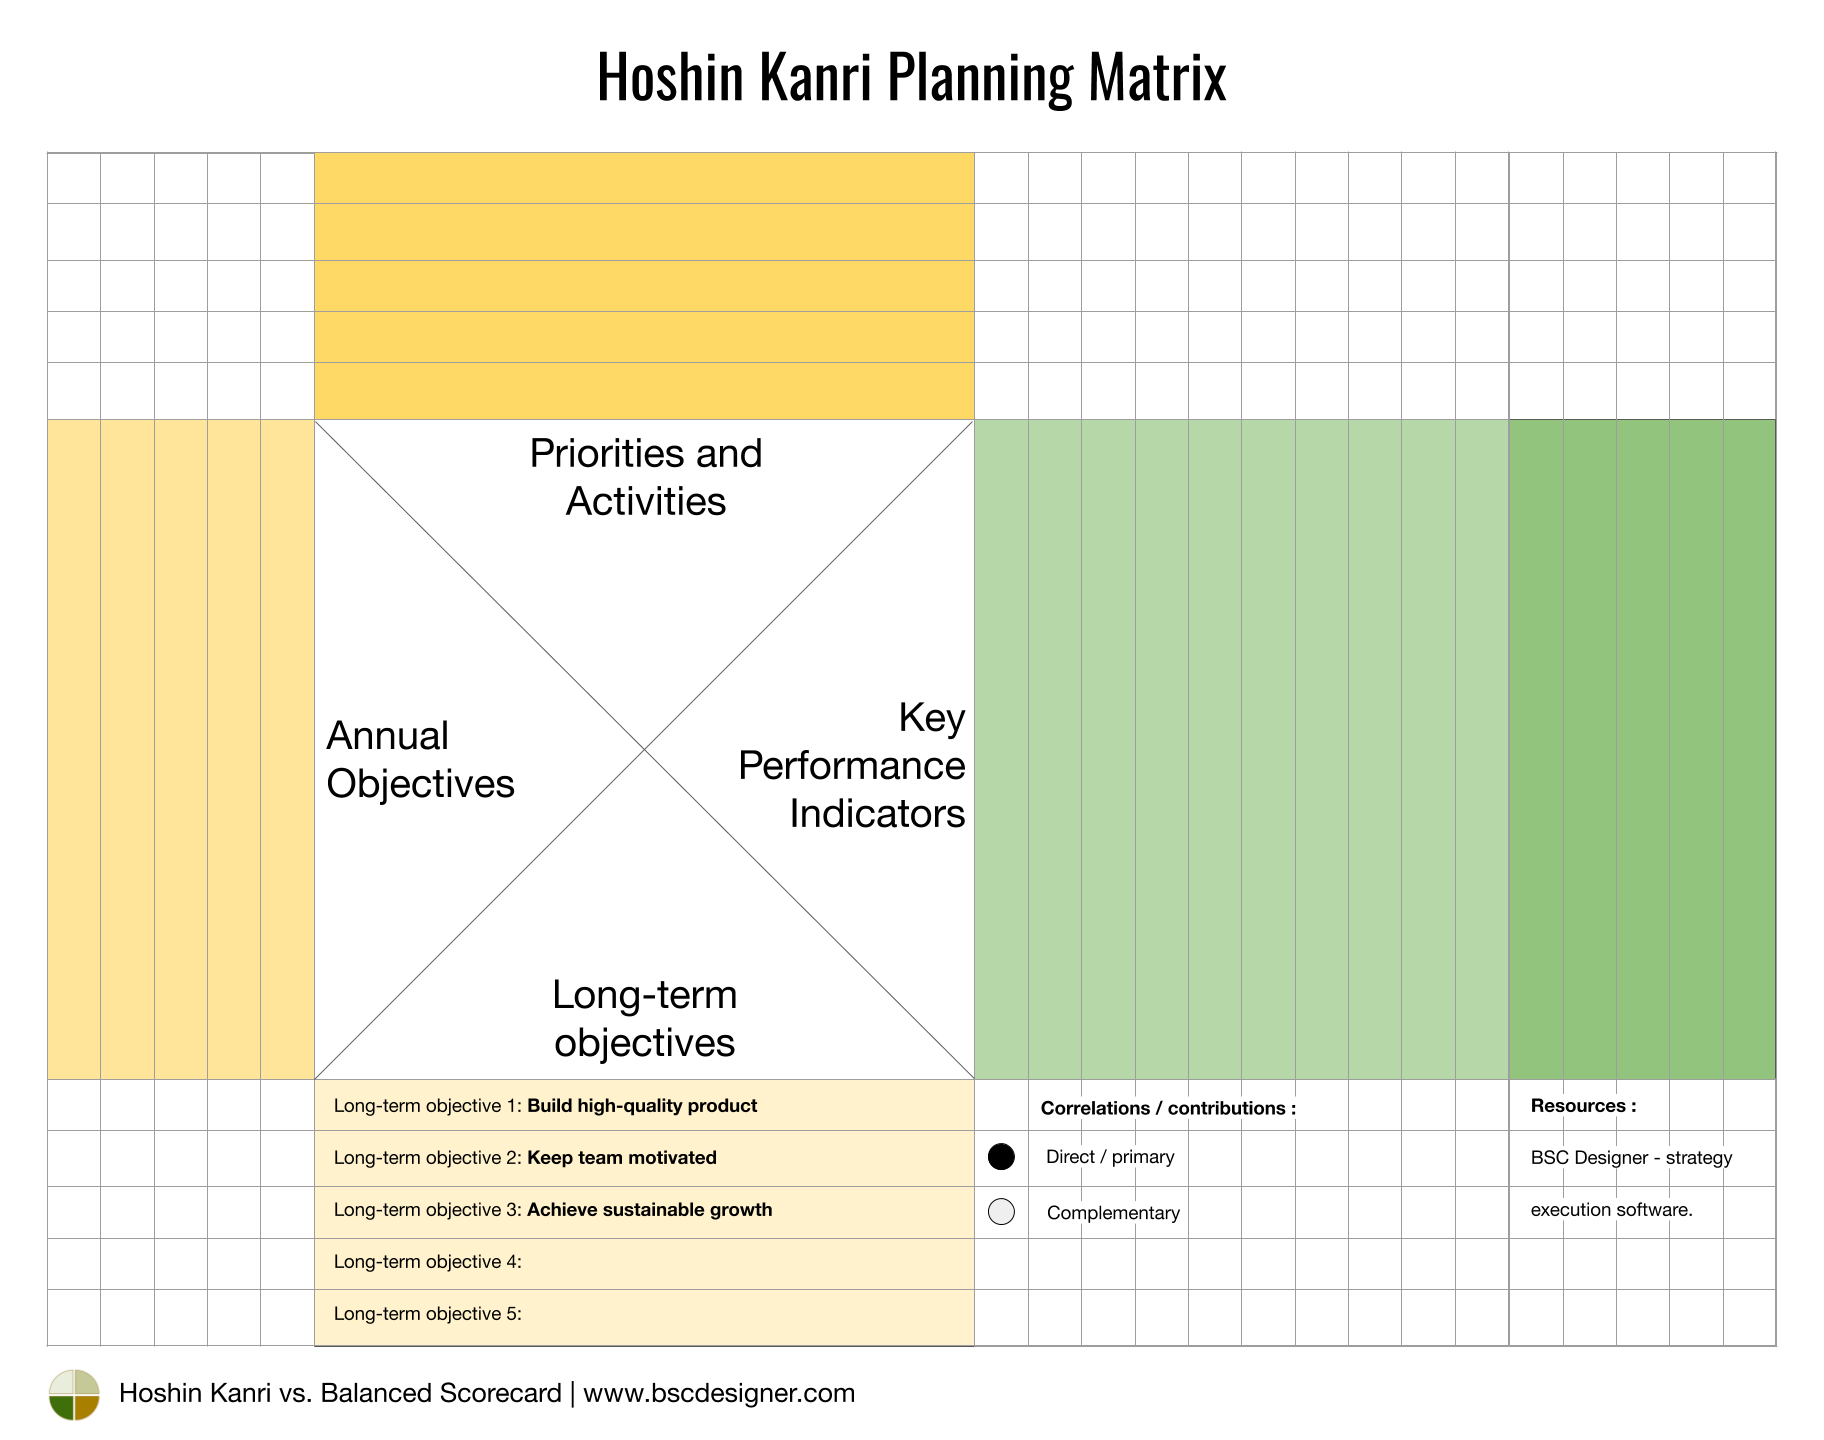
Long-Term Goals
Here are the guiding principles to follow:
- We start with the “southern” part and put the long-term goals there
- In the “western” part, we put the annual objectives
- Annual objectives are aligned to the long-term goals; we mark these alignments using black and white circles
In my example, the long-term (strategic, if you want) goals are:
- Build high-quality product
- Keep team motivated
- Achieve sustainable growth
Download Hoshin Kanri PDF Template
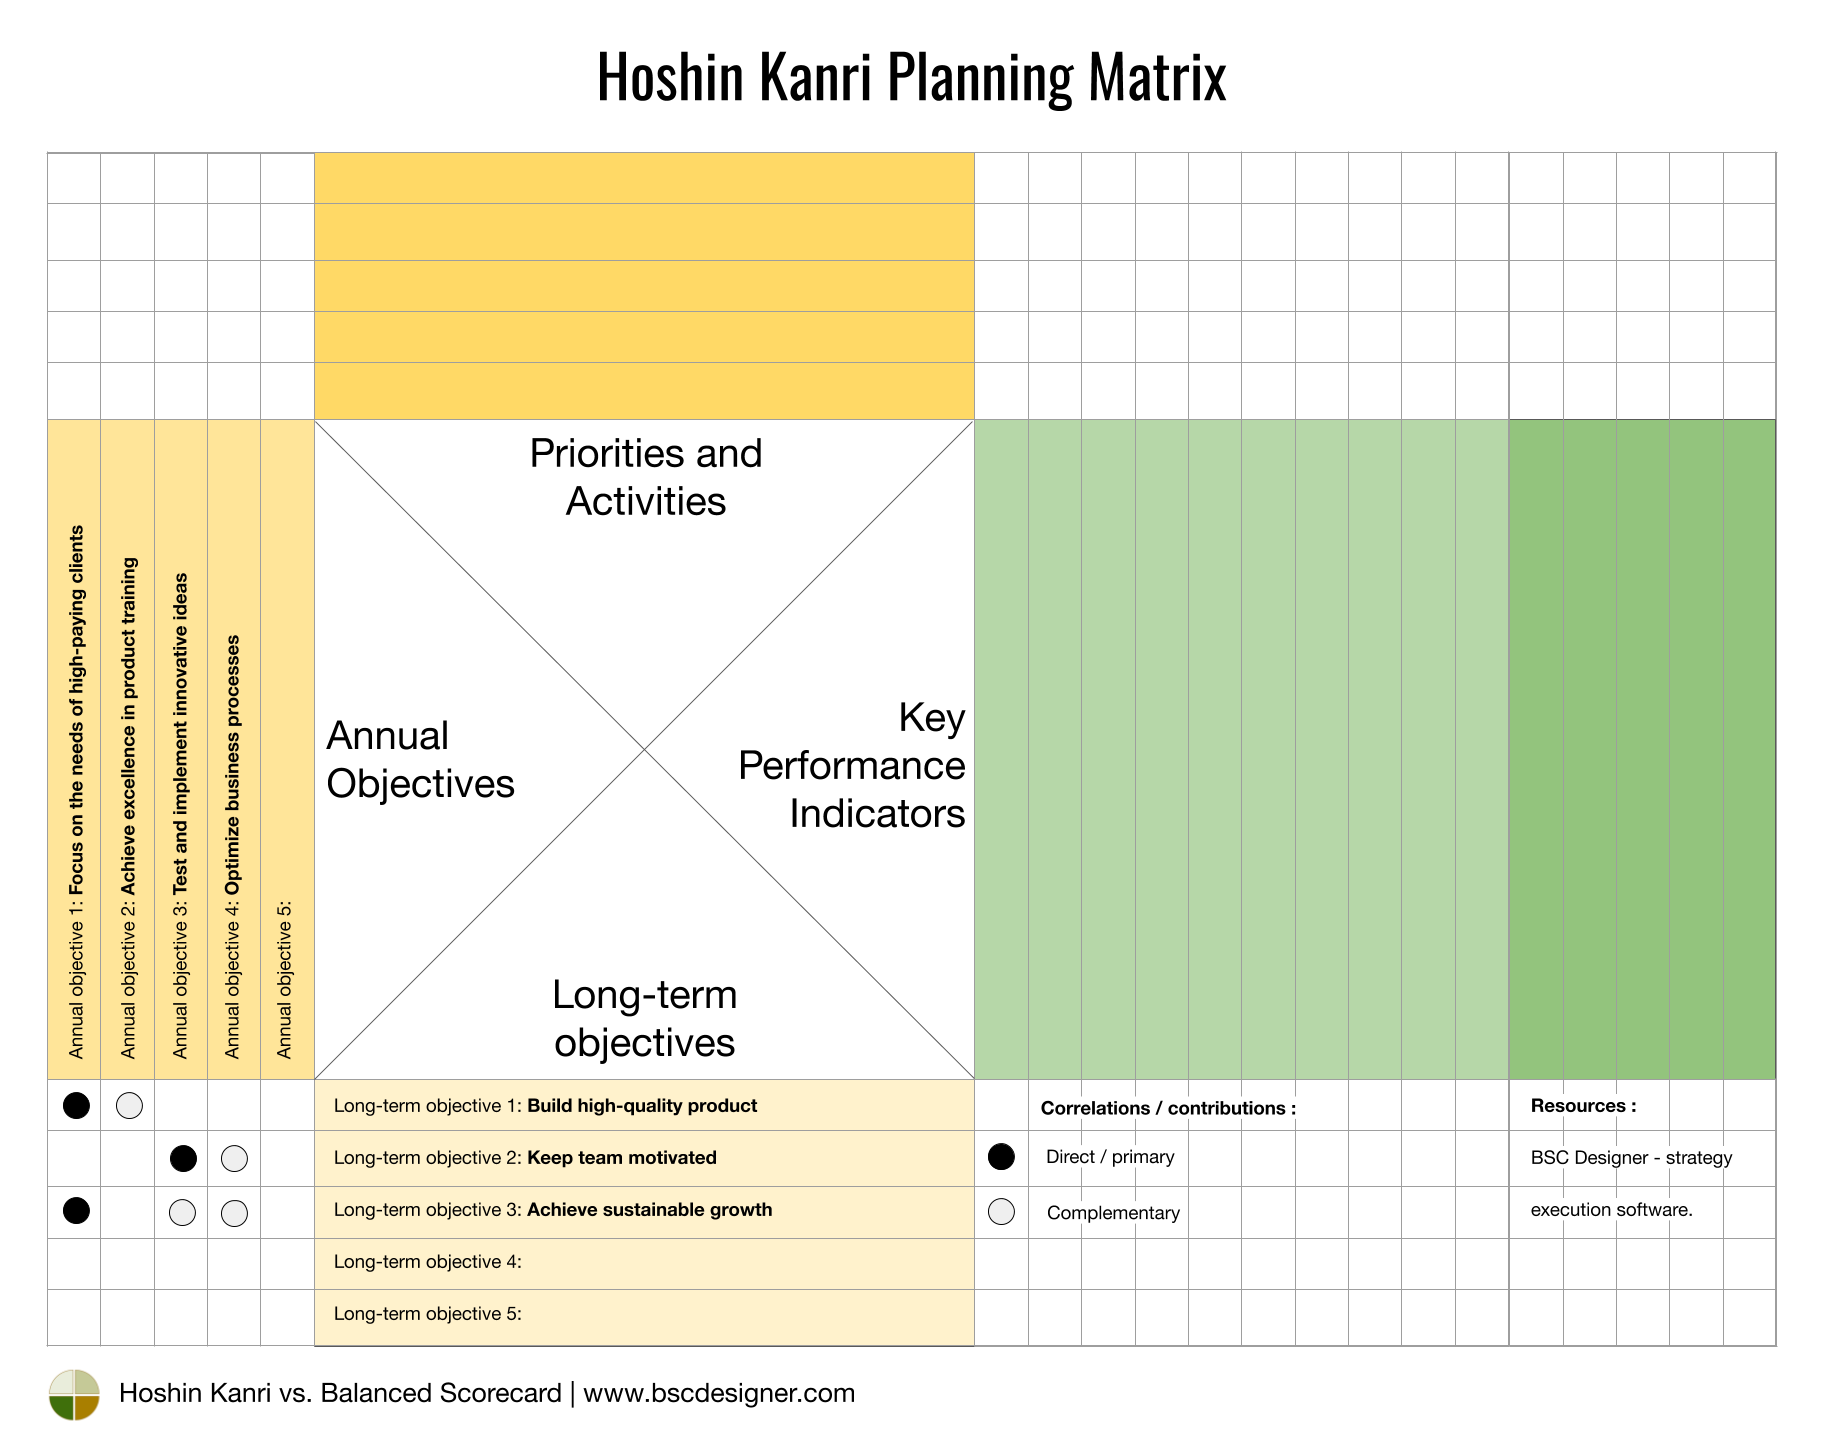
Annual Goals
The annual objectives that are aligned with these long-term goals are:
- Focus on the needs of high-paying clients
- Achieve excellence in product training
- Test and implement innovative ideas
- Optimize business processes
Following the marks on the matrix, I can see that the “Long-term objective 1: Build high-quality product” goal…
- Is supported by “Annual objective 1: Focus on the needs of high-paying clients.”
- Is aligned with the complementary “Annual objective 2: Achieve excellence in product training.”
Download Hoshin Kanri PDF Template
Activities
Using the same approach, we move to the lower level of abstraction to fill in the “northern” part of the matrix.
- We already have annual objectives, so now we map the activities (or improvements) that support those objectives.
- We use the same circles notation to explain the impact of activity on the objective.
In my example, the “Annual objective 1: Focus on the needs of high-paying clients” is aligned with these primary activities:
- Activity 1: Modify customer support policies
- Activity 4: Plan the development of new product features
And this complementary activity:
- Activity 2: Implement video tutorials
Download Hoshin Kanri PDF Template
Performance Metrics
Finally, we need to define the metrics for the activities and the persons responsible for the execution of those activities. We’ll use the “eastern” part of the matrix for that purpose.
For example, from the matrix, I can see that ¨Activity 1: Modify customer support policies¨ is measured by:
- KPI 01: Time to respond for high-paying clients
- KPI 02: Churn rate for high-profile clients, %
As for the persons responsible, the matrix tells me that “Owner 2: Customer service team” is responsible for this goal.
Download Hoshin Kanri PDF Template
Describing the Same Strategy with Balanced Scorecard
Now, let’s describe the same strategy using the Balanced Scorecard strategy map. I’m going to automate my experiment with BSC Designer software.
Long-Term Objectives on the Balanced Scorecard
Let’s start with the long-term objectives from Hoshin Kanri. To present the same idea in the Balanced Scorecard paradigm, I have several options:
- Option A. The long-term objectives from Hoshin Kanri fit well into the concept of strategic priorities or strategic themes.
- Option B. Another idea is to use the perspectives of the Balanced Scorecard (Finance, Customer, Internal, Learning and Growth) as the analogies of the long-term objectives.
- Option C. Keep the original strategic themes and perspectives of the Balanced Scorecard and simply add more levels to the hierarchy of the goals.
I don’t like Option B, as in this case, we are losing an important part of the Balanced Scorecard – its cause-and-effect logic along the perspectives.
Option C is possible and can be easily implemented since I’m using the automation software, but I think, in this case, it will be excessive and will overload the map with unnecessary details.
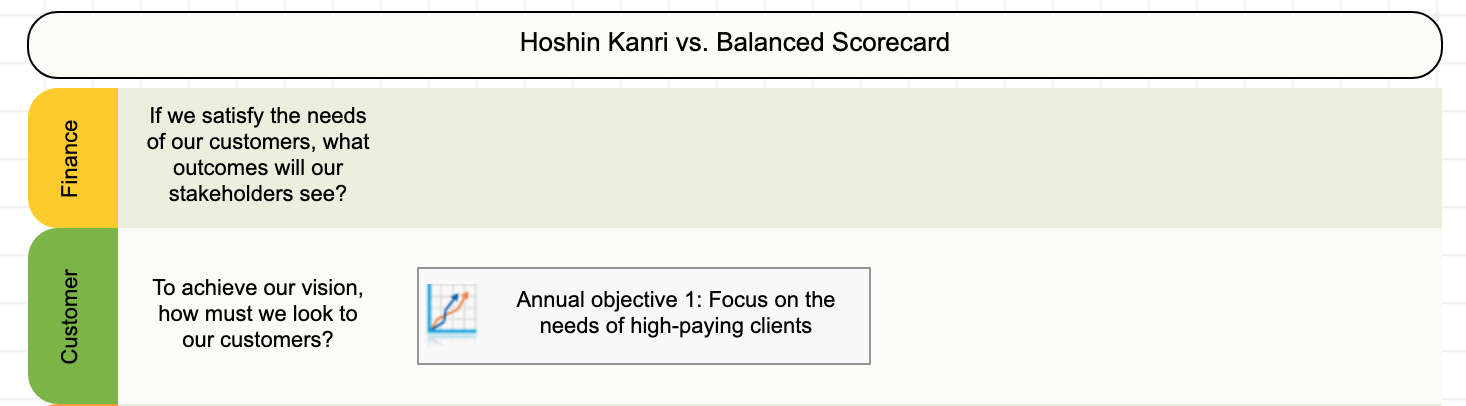
For this experiment, let’s use option A:
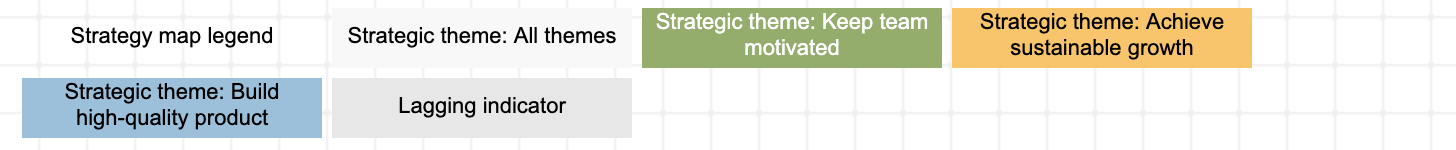
- I can use the strategic themes tool in BSC Designer to describe the long-term priorities.
- Once I specify that some goals belong to those themes, the software will show the themes in the legend of the map.
- For the “Annual objective 1: Focus on the needs of high-paying clients” I’ll use the sub-goals approach
Now, we can map the “annual objectives” from the X matrix:
- I will map the objectives into corresponding perspectives
- I’ll assign strategic themes to the business goals, as we did on the X matrix
Some observations along the way…
“All themes” Option to Support Multiple Themes
On the Hoshin Kanri matrix, there are some goals that belong to the multiple themes.
For example, “Annual objective 1: Focus on the needs of high-paying clients” belongs to “Build high-quality product” and “Achieve sustainable growth.” In the Balanced Scorecard paradigm, this case is covered under the “All themes” option.
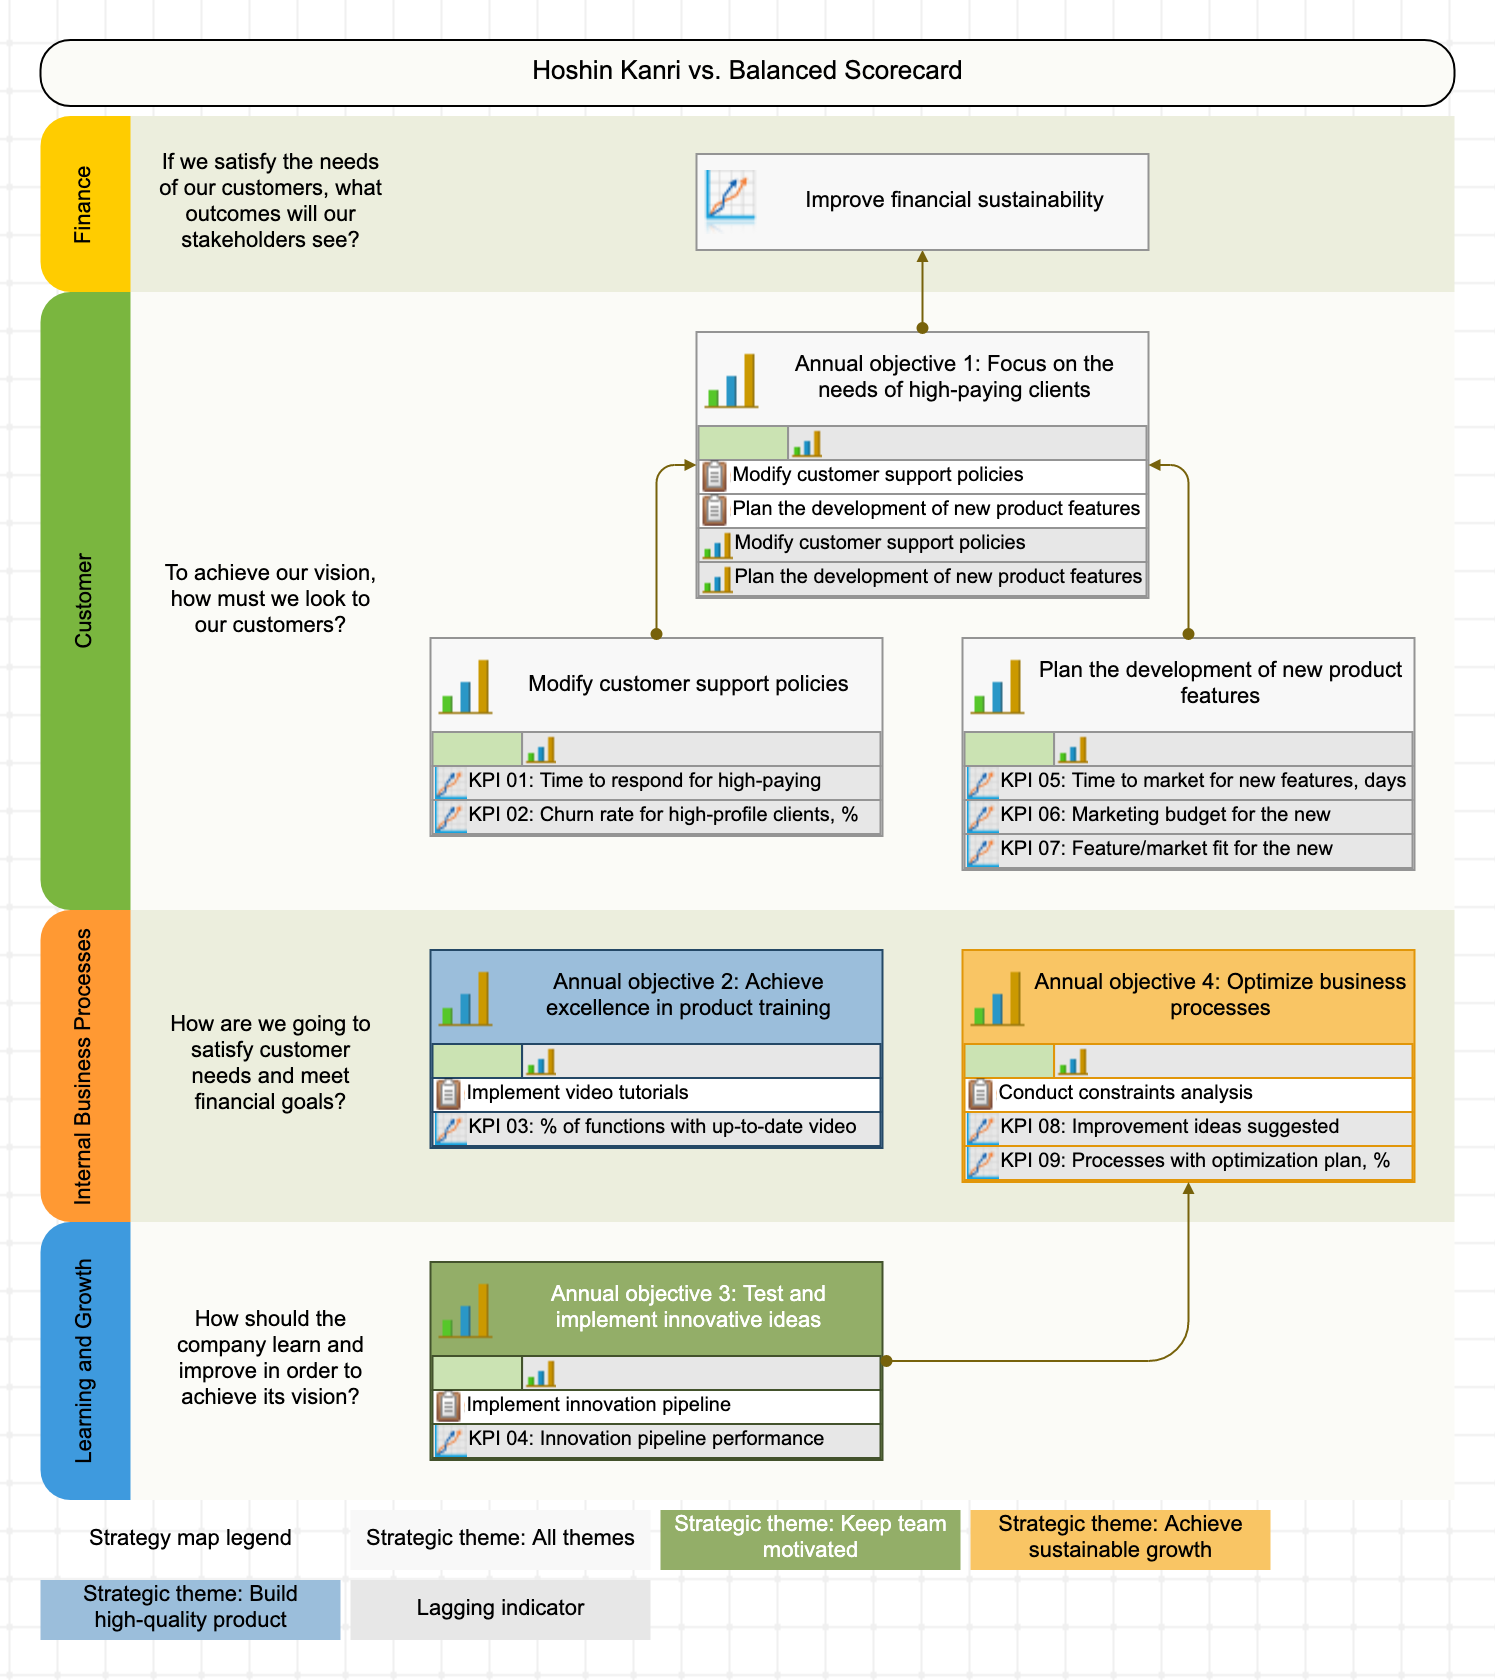
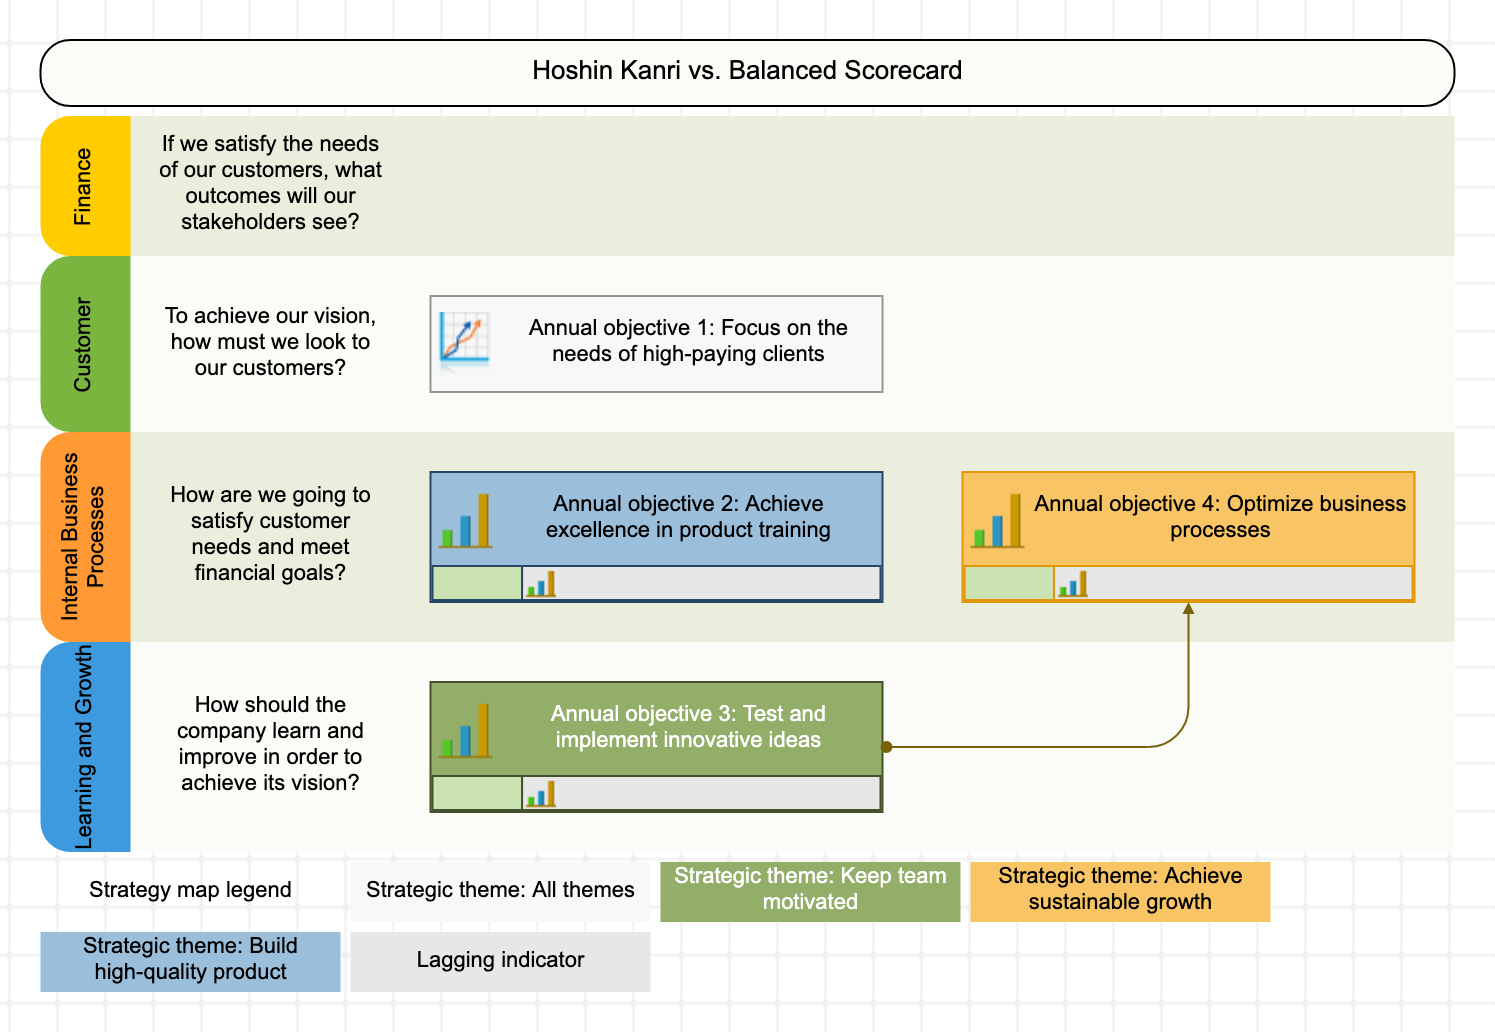
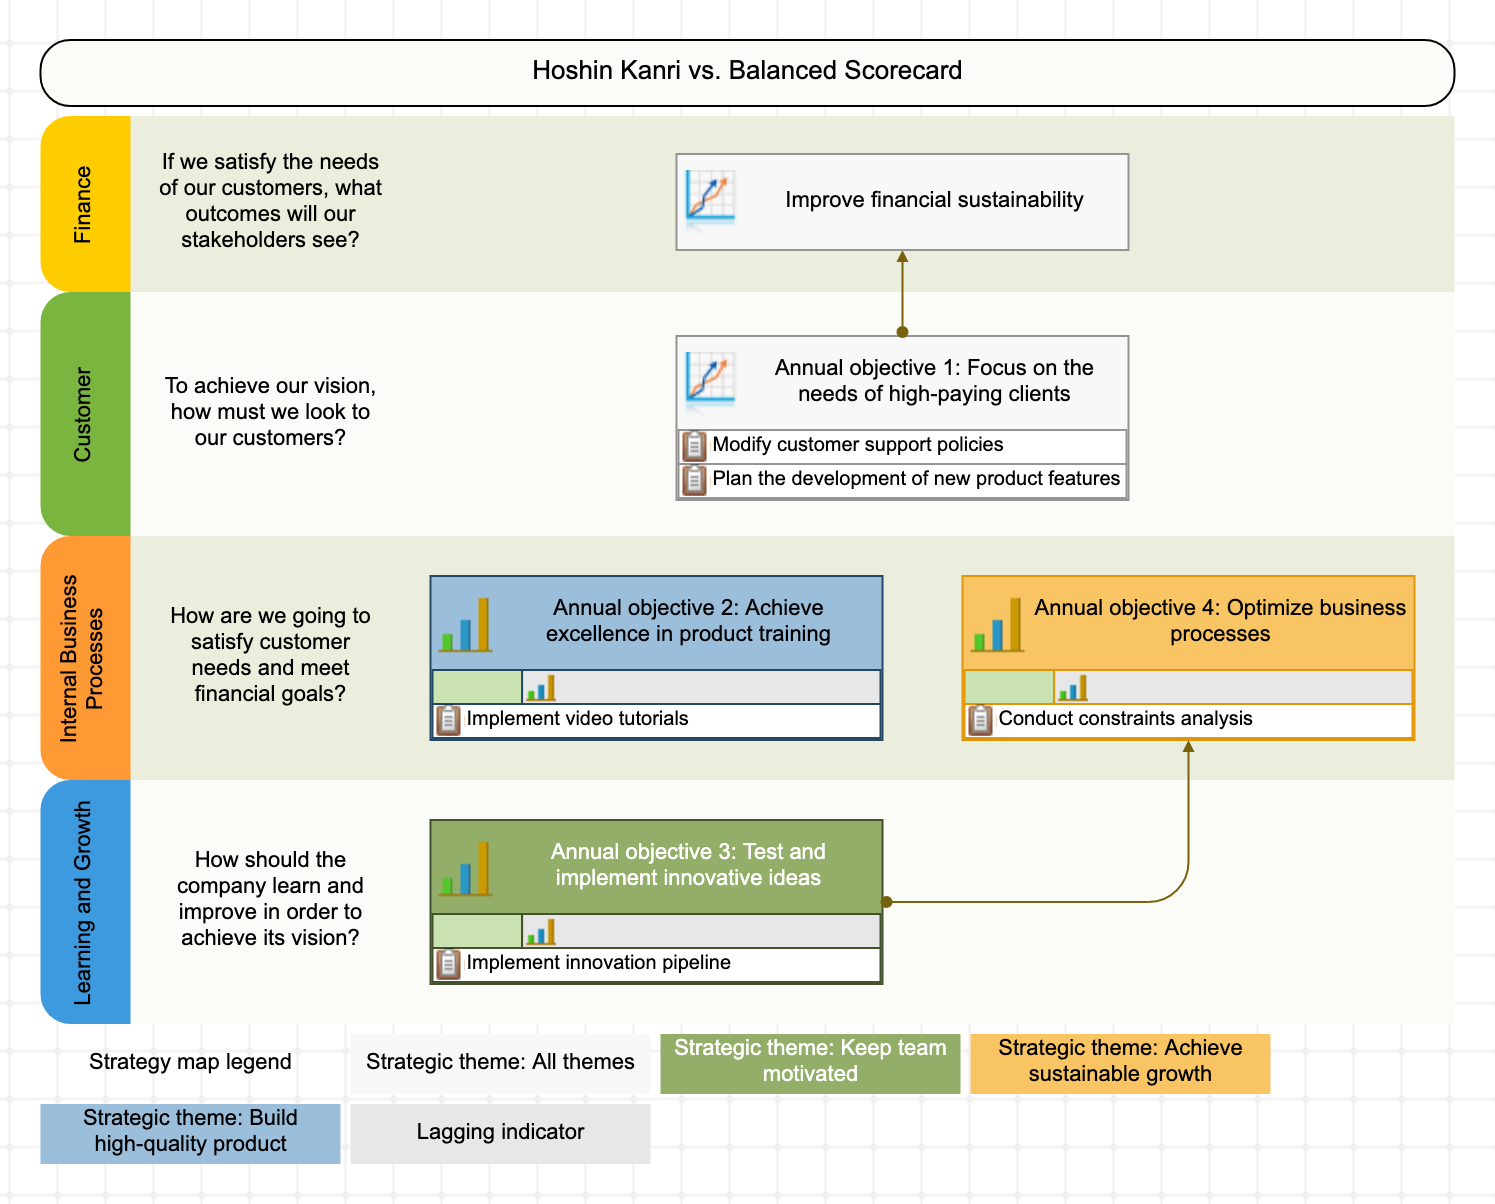
Cause-and-Effect Logic Becomes More Clear
From the X matrix, it was not clear if/how the long-term objectives support each other.
From the strategy map, it is more obvious, and I can underline this by linking the goals. For example, we can connect “Test and implement innovative ideas” to the “Optimize business processes” goal to explain the relationship between them more explicitly.
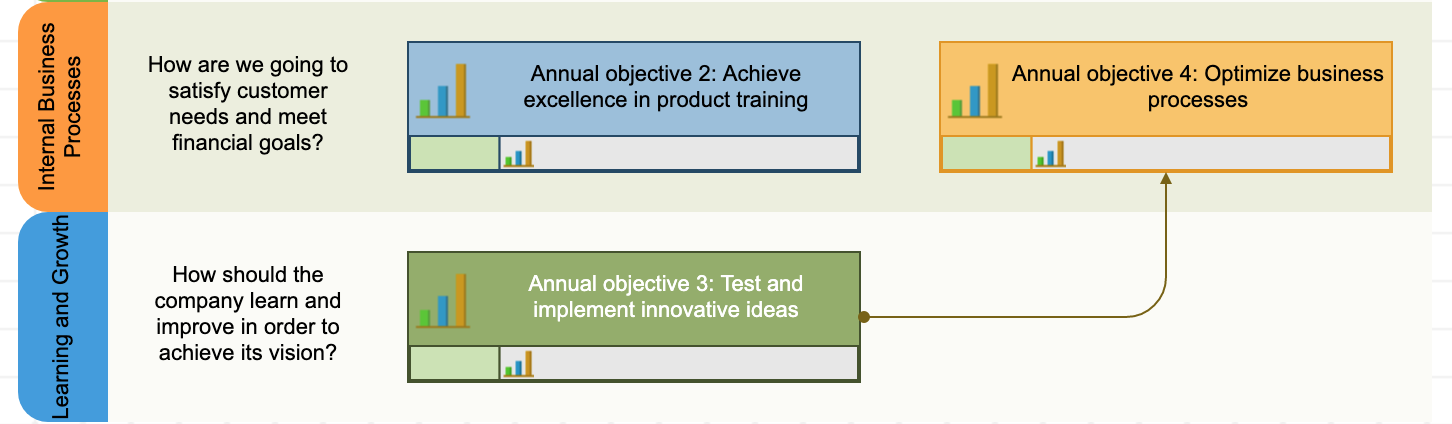
In this context, if we follow the classical Balanced Scorecard, it gives us a good structure for the description of the strategy.
Missing Goals Detected
As you can see, the Financial perspectives of the strategy map remained empty. Basically, it means that our strategy explains what needs of the customer we plan to satisfy, but we don’t know why we want to satisfy these needs.
What financial or stakeholder results do we plan to achieve by satisfying customer needs? Improve revenue? Decrease costs? The strategy map template suggests me to give an explicit answer here.
We can use a generic “Improve financial sustainability” goal.
Let’s go ahead to the next sector of the X matrix – the priorities and activities. In the Balanced Scorecard, we can use a similar tool called initiatives. Using automation software, I aligned respective initiatives with the goals.
Indicators are Aligned with the Goals, not Activities
On the final step, we’ll align indicators and persons responsible with the goals.
Here is an important difference between the Hoshin Kanri X matrix and the Balanced Scorecard approach.
- In Hoshin Kanri, the goals are represented via their activities, and the activities are measured by the indicators.
- In the Balanced Scorecard, activities are aligned with the goals, but when it comes to indicators, we align indicators with the goals, not with the activities.
In this case, I’d recommend the Balanced Scorecard’s approach, as Hoshin Kanri promotes a dangerous idea that all performance metrics are supposed to be the metric of activities. That’s not always the case. My recommendation is to keep the initiative and the metric part separated and group them around the goal, not the activities.
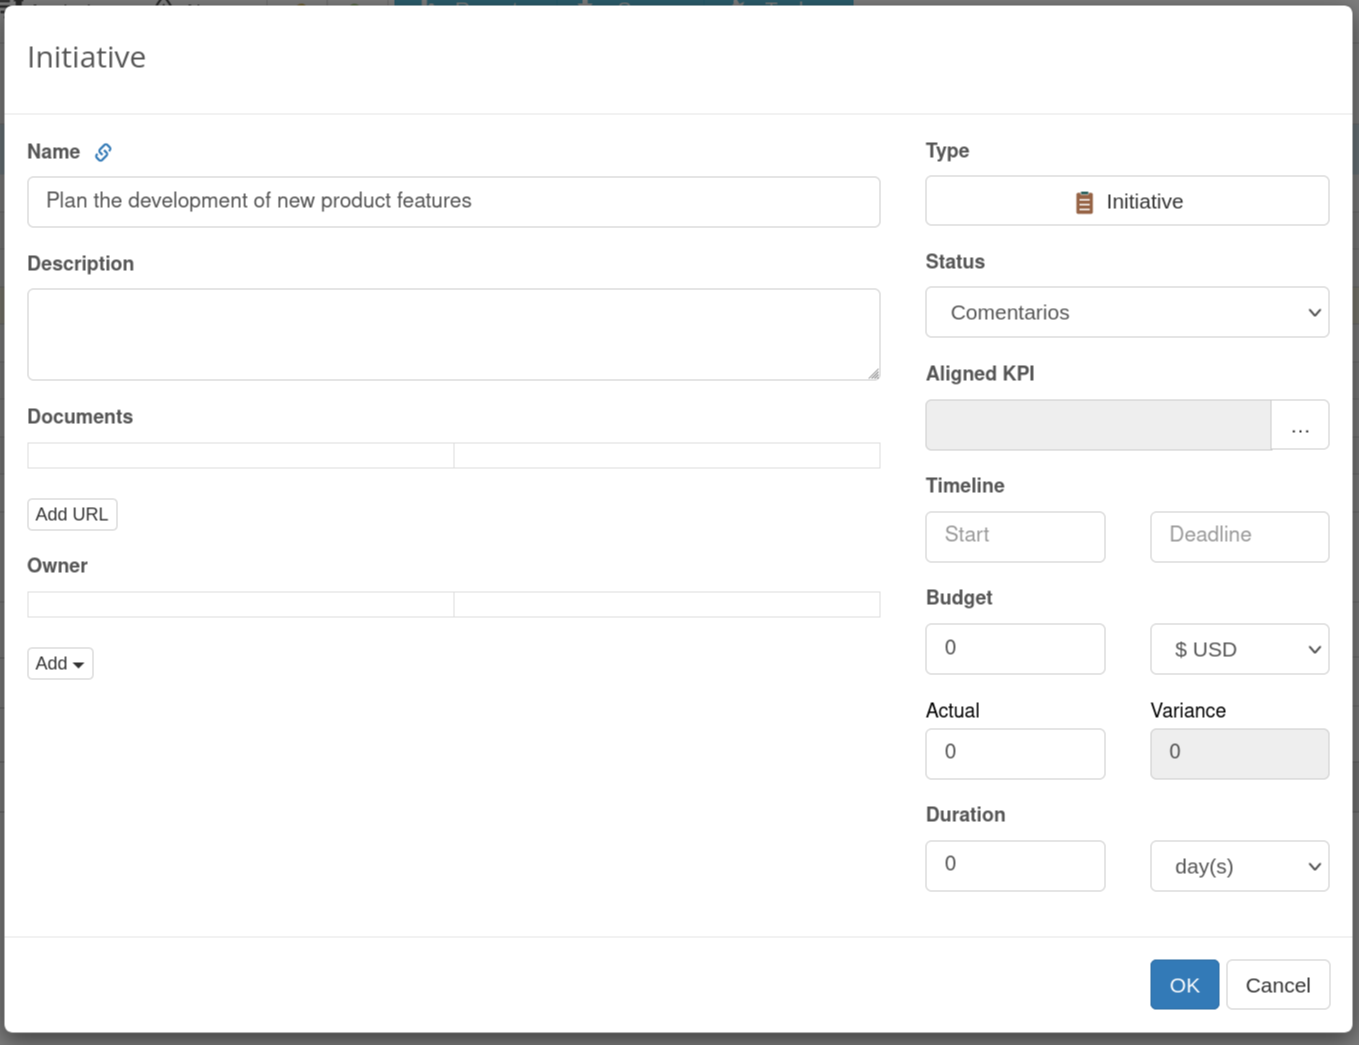
More Data for the Initiatives
We have a set of indicators aligned with the goals, and now we can assign persons responsible for the goals and/or specific indicators.
I’m using automation software, so I can do some other interesting things:
- Assign budget and timeline to the initiative
- Link some of the indicators to the external scorecards
- Visualize some performance data right on the strategy map
- Assign access rights to the scorecard or indicators
The Outcomes of the Experiment
We have used the Balanced Scorecard’s strategy map to describe the same strategy that we described on the Hoshin Kanri X matrix.
How are those two diagrams compared?
- Both are one-page diagrams.
- Both help to understand what the strategy is, how we are going execute it and how we are going to track our performance along the way.
- The X matrix supports only straight (waterfall-style) logic from the long-term goals to the activities. The Balanced Scorecard is more flexible in this sense and allows explaining the relationship between the goals of the same level.
- The X matrix limits the set of possible performance metrics to the activity related metrics only.
The frameworks don’t guarantee that we’ll focus on the correct goals and indicators, but each helps to build a better strategy.
- Hoshin Kanri has its clearly defined four levels of abstraction and hard connection between the goals and activities.
- The Balanced Scorecard helps to validate the integrity of the strategy (see the way we found a missing financial goal).
Both business tools have their advantages and disadvantages:
- Before, we have discussed the advantages and the limitations of the Balanced Scorecard.
- Below, I’m sharing some thoughts about the Hoshin Kanri.
The Advantages and Disadvantages of Hoshin Kanri X-Matrix
This one-page matrix is an excellent tool to visualize the strategy.
The obvious advantages of the X-Matrix are:
- It’s visual and easy to read
- It describes strategy on four levels of abstraction
- It visualizes direct and complementary contributions
What are the limitations of the X-Matrix:
- The number of goals/indicators is limited. We can use a paper of larger size or split strategy into the parts, but this will impact its readability.
- The number of levels on one diagram is limited to four.
- The strategy is presented as the number of isolated pillars, and it’s not clear if one annual objective can contribute to another one. This can be solved in the supporting documentation.
As discussed below, the X-Matrix was designed to be used on paper, and the attempts to automate it change its essence and impact the visibility of the big picture view.
Automation Software for Hoshin Kanri
The Hoshin Kanri matrix is an excellent tool to present a certain part of the strategy on a single page of paper. Moreover, with this matrix, we are able to look at different levels of strategy at the same time:
- Long-term strategic goals
- Annual operational goals
- Activities
- KPIs
There are certainly software tools that automate the Hoshin Kanri approach on the computer screen. In my opinion, that’s not the best use of automation software, as in this case, we are trying to automate something that was initially designed for use on paper.
In this sense, the Balanced Scorecard framework is much more flexible in terms of automation.
Final Word: Strategy is Not Just About a Framework
Honda’s intervention in the Western market of motorcycles was always given as an example of excellent strategy planning (one of the explanations was given by the Boston Consulting Group).
Richard Pascale, co-author of The Art of Japanese Management (1981) did his own research. According to the interviews that he did with those managers who were the first to arrive in the U.S., the story looked a little bit different.
Having a short budget, and limited governmental support, four managers of Honda had to rent a cheap apartment in Los Angeles, two of them were sleeping on the floor. In the beginning, their major promotion method was just to drive around to attract attention… According to their own word,s they had no specific strategy at all, just an idea about trying to sell in the U.S.
With this story, I wanted to illustrate that we should not overestimate the role of frameworks in strategic planning. Those excellent ideas are born during the brainstorming sessions, and the frameworks like Hoshin Kanri or the Balanced Scorecard help to articulate those ideas and control their execution.
What do you think about Hoshin Kanri? Let’s discuss it in the comments.
What's next?- Follow our
 Strategy Implementation System to align stakeholders, strategic ambitions, and business frameworks into a comprehensive strategy.
 - Automate strategic planning with BSC Designer by organizing goals, initiatives, risks, and KPIs into scorecards.
More About Strategic Planning


![]() CEO | Author | Speaker
CEO | Author | Speaker
BSC Designer is strategy execution software that enhances strategy formulation and execution through tangible KPIs. Our proprietary strategy implementation system reflects our practical experience in the strategy domain.