Finding and implementing good performance metrics is a tough task. There are some good examples of simple metrics, but when it comes to something less tangible the task to find a good indicator looks like an impossible one, but actually it is not.
This system is a step-by-step approach to find and deal with the most challenging metrics. The next time you need to track someone’s performance, estimate the quality, or analyze the value created, use this time-proven system to come up with good indicators and improve existing ones.
The Steps of the KPI System
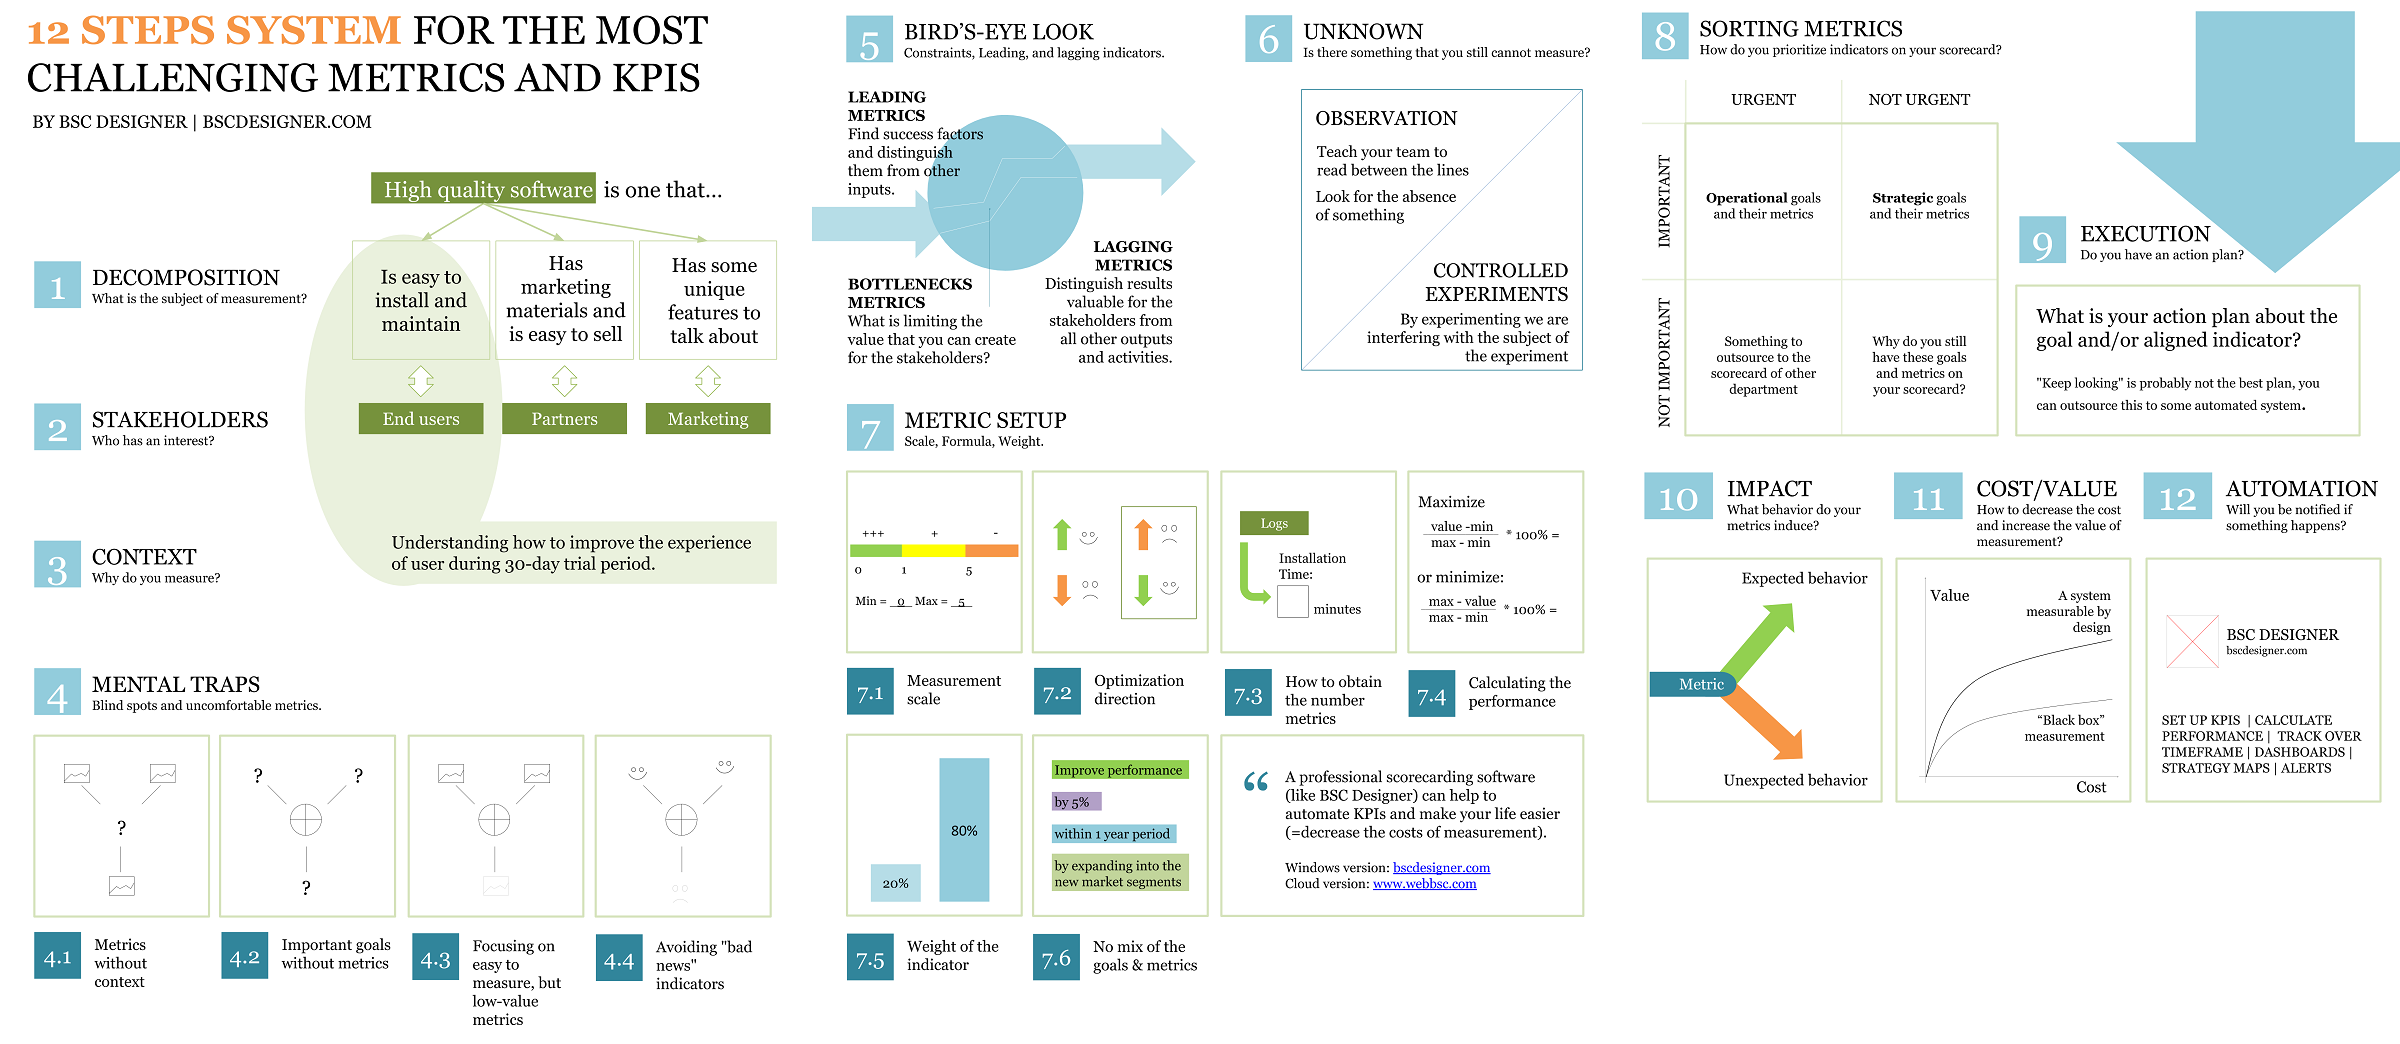
The system consists of 12 steps. Make sure you have carefully reviewed Steps 1-3. That’s your basis for dealing with challenging metrics!
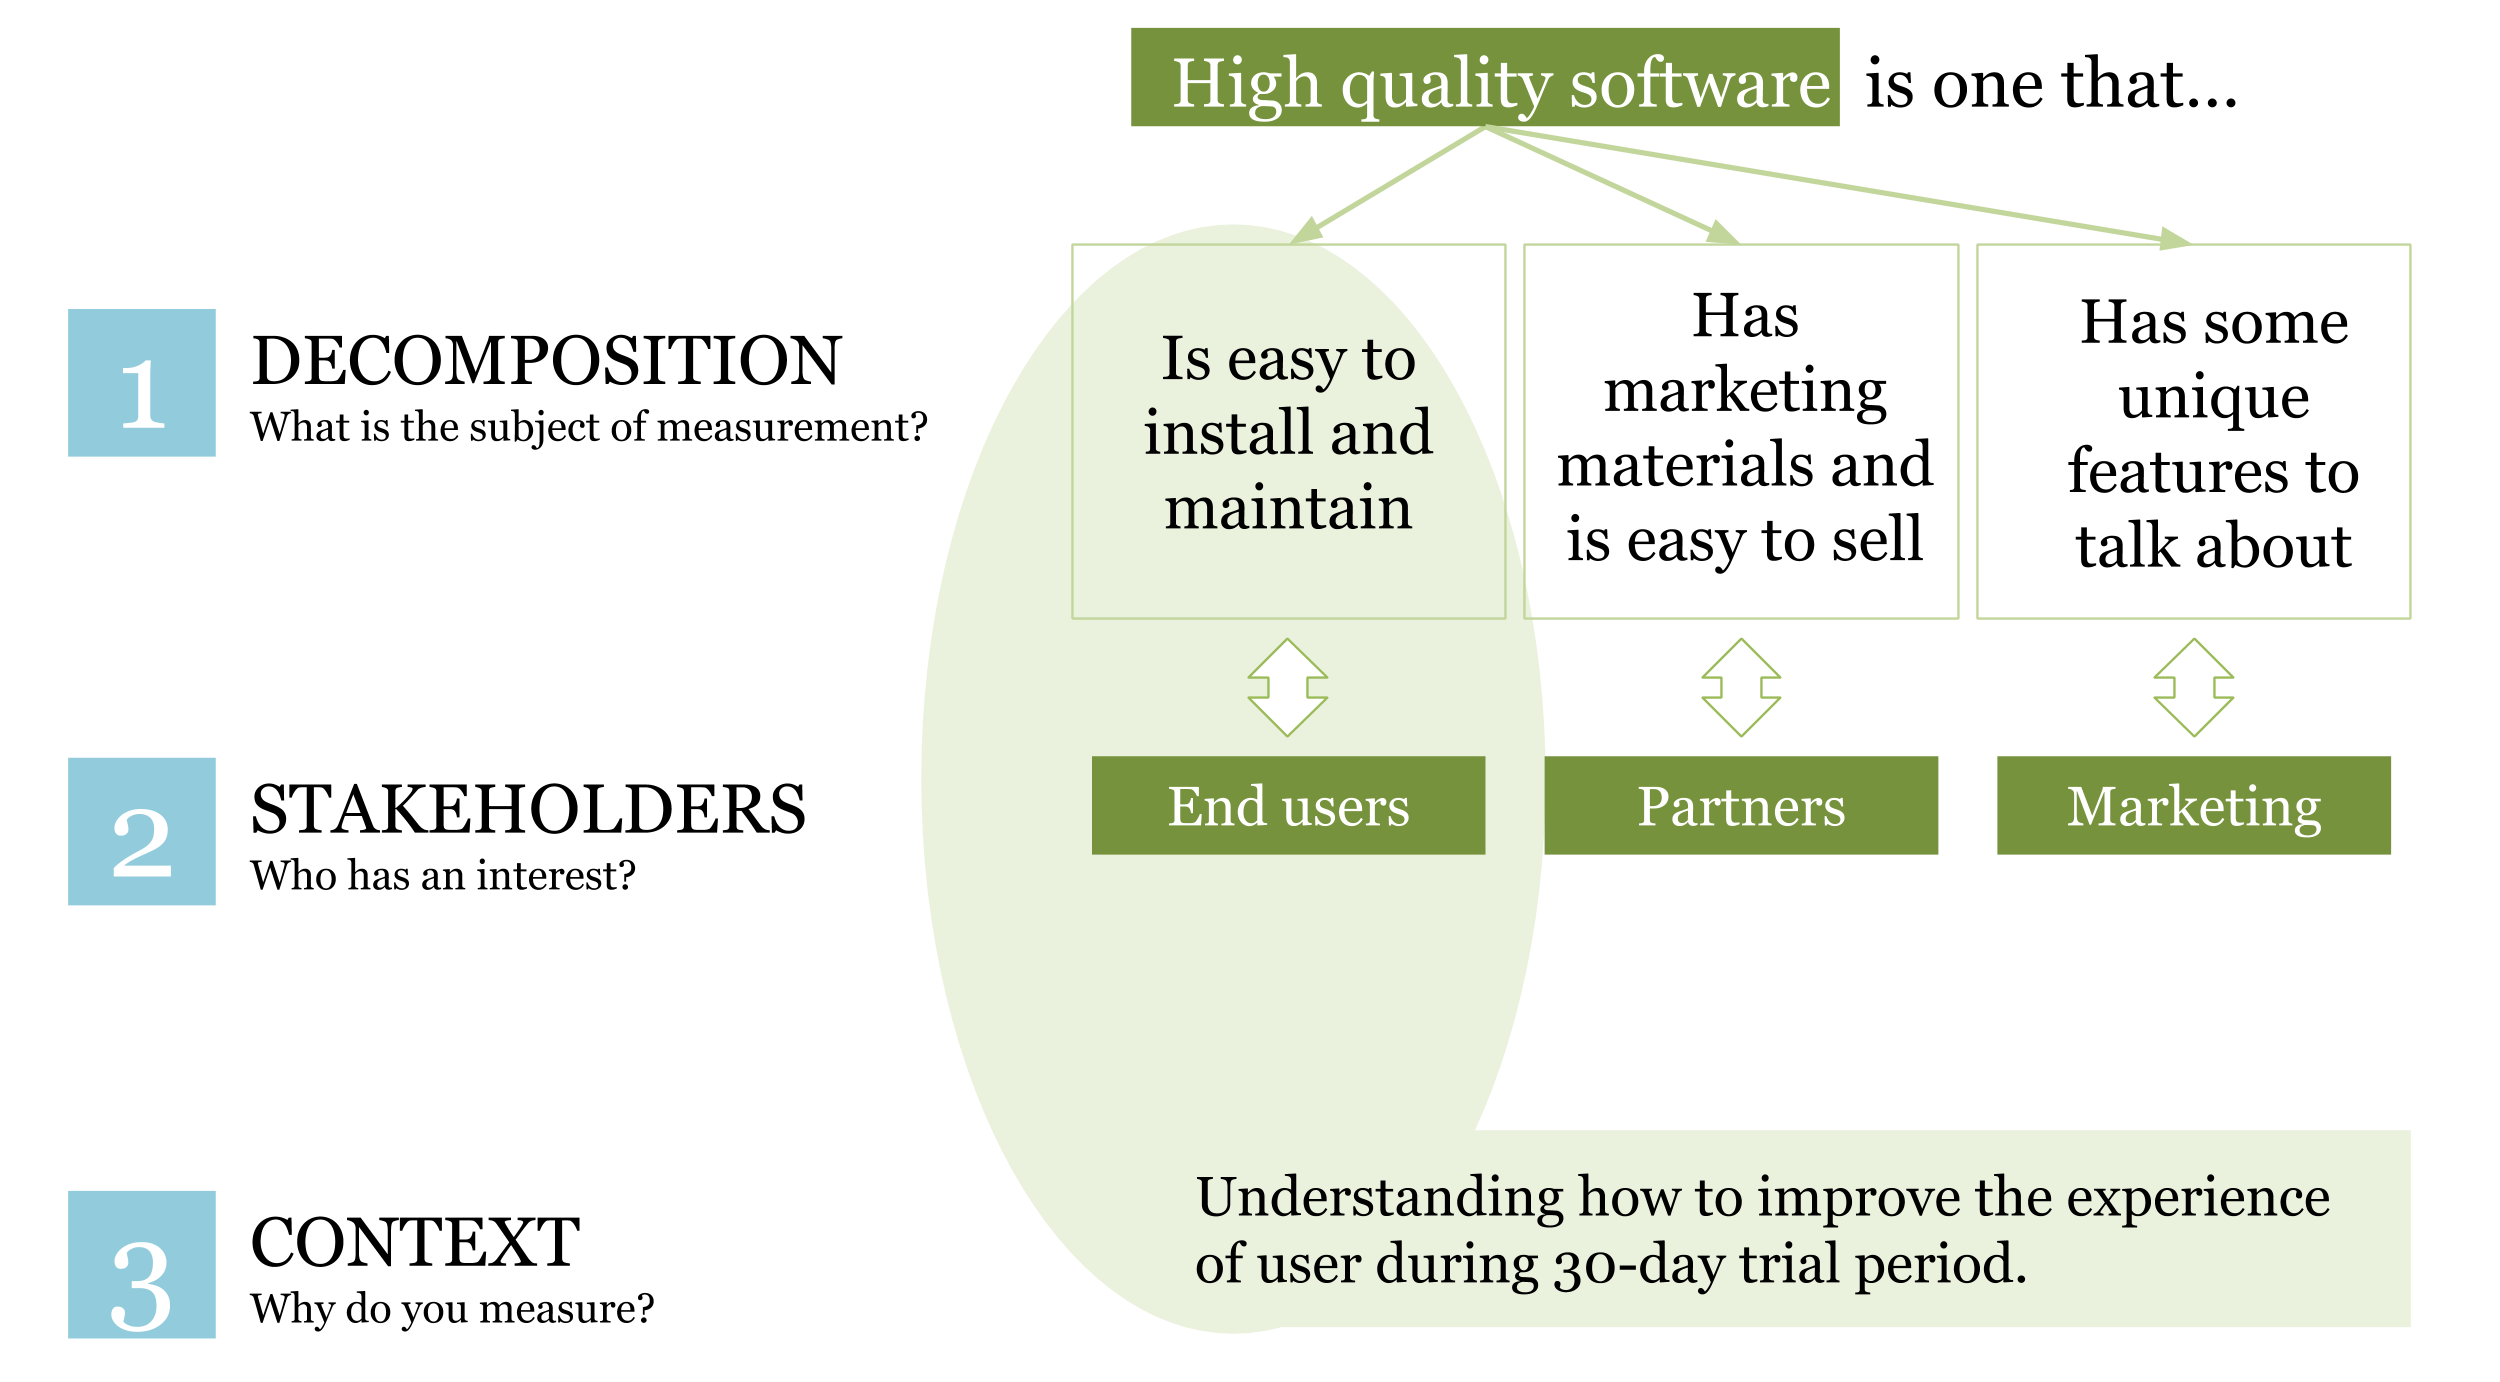
1. Decomposition. What is the Subject of Measurement?
Let’s take a difficult subject to measure, like for example “quality.” From the first look it is intangible, and is not measurable, but let’s do a short exercise and try to define what is “quality,” for example, if we are talking about the quality of a software.
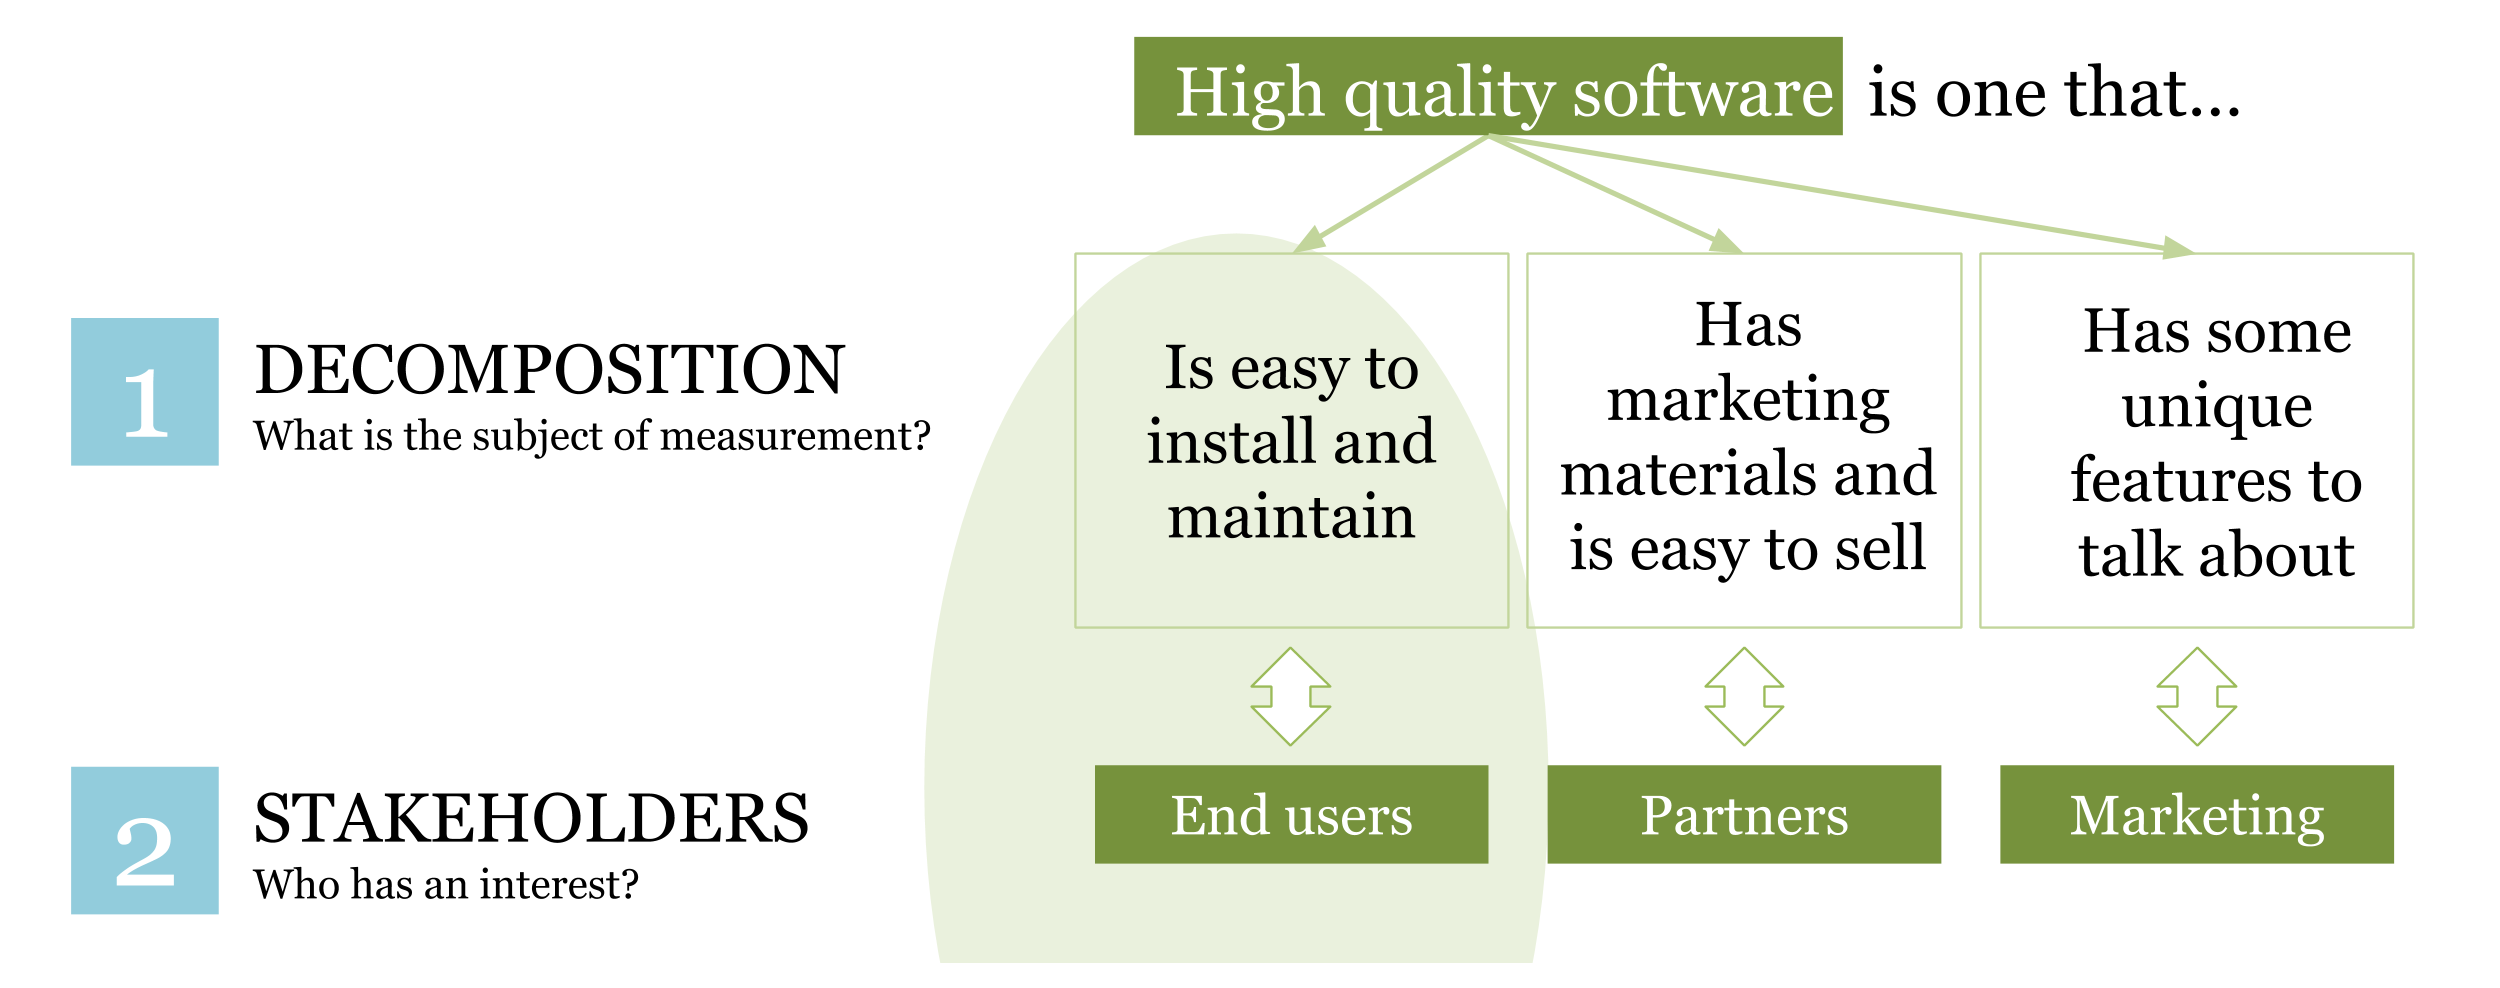
High quality software is one that:
- Is easy to install and maintain (user’s view)
- Is well documented (user’s view)
- Doesn’t show critical error messages (user’s view)
- If something is broken it is fixed fast (user’s view)
- Has a lot of marketing materials and is easy to sell (partner’s view)
- Has clear architecture, and introducing changes is easy (engineer’s view)
- Passed required tests (tester’s view)
- Has some unique features to talk about (marketing specialist’s view)
- Generates good profit (shareholder’s view)
The point of this exercise is that we broke down the intangible idea of “quality” into smaller, more specific (=quantifiable and measurable) parts. Some of these parts can still be broken down even more. But for the purpose of this example we can stop on this level. We already have something tangible. For example, we can quantify and then measure:
- Time in minutes needed to install the software (for “easiness to install” part); or
- Test coverage, % (for “passed tests” part)
The same decomposition exercise can be done with other intangibles like “value,” “performance,” or “engagement.” For more examples and various statistical tools check out the books by Douglas W. Hubbard from “How to Measure Anything…” series.
If you want to follow up with the topic of quality, I do recommend for you the full guide into Quality KPIs and Scorecard.
2. Stakeholders. Who Has an Interest?
Another important outcome of the previous exercise is that we now know that the “quality of the software” has a different meaning to different people (stakeholders). For a formal definition of the “stakeholders” term, have a look at Tom Gilb’s glossary:
Stakeholders are any person, group or system, that have or we want to have an interest in our project.
I have mentioned some stakeholders, but there are certainly more of them. For example, if we are talking about the quality of security software, then there are certain legal aspects that a software should comply with. Be sure that you have a long list of the stakeholders, not just typical “end customers” and “shareholders!”
3. Context. Why Do You Measure?
The answer “We measure in order to get some numbers/analyze/validate/estimate” is not acceptable! Good answers sound something like these:
- To achieve an agreement about {some specific challenges here}
- To make a better decision about {some specific goals here}
- To track our success towards {some specific goal here}
By answering this question we can narrow the measurement efforts down even more. For example:
We want to measure software quality in order to understand how to improve the experience of user during 30-day trial period.
 This answer changes our focus on the measurement. We’ll need to look at:
- How engaging the marketing materials are
- How easy it is to install the software
- How fast can customer service answer pre-sale questions
- What critical problems might the user face during the test period
4. Mental Traps. Blind Spots and Uncomfortable Metrics.
We are all human beings, try to detect and avoid some typical “mental traps” that happen when we are looking for new metrics.
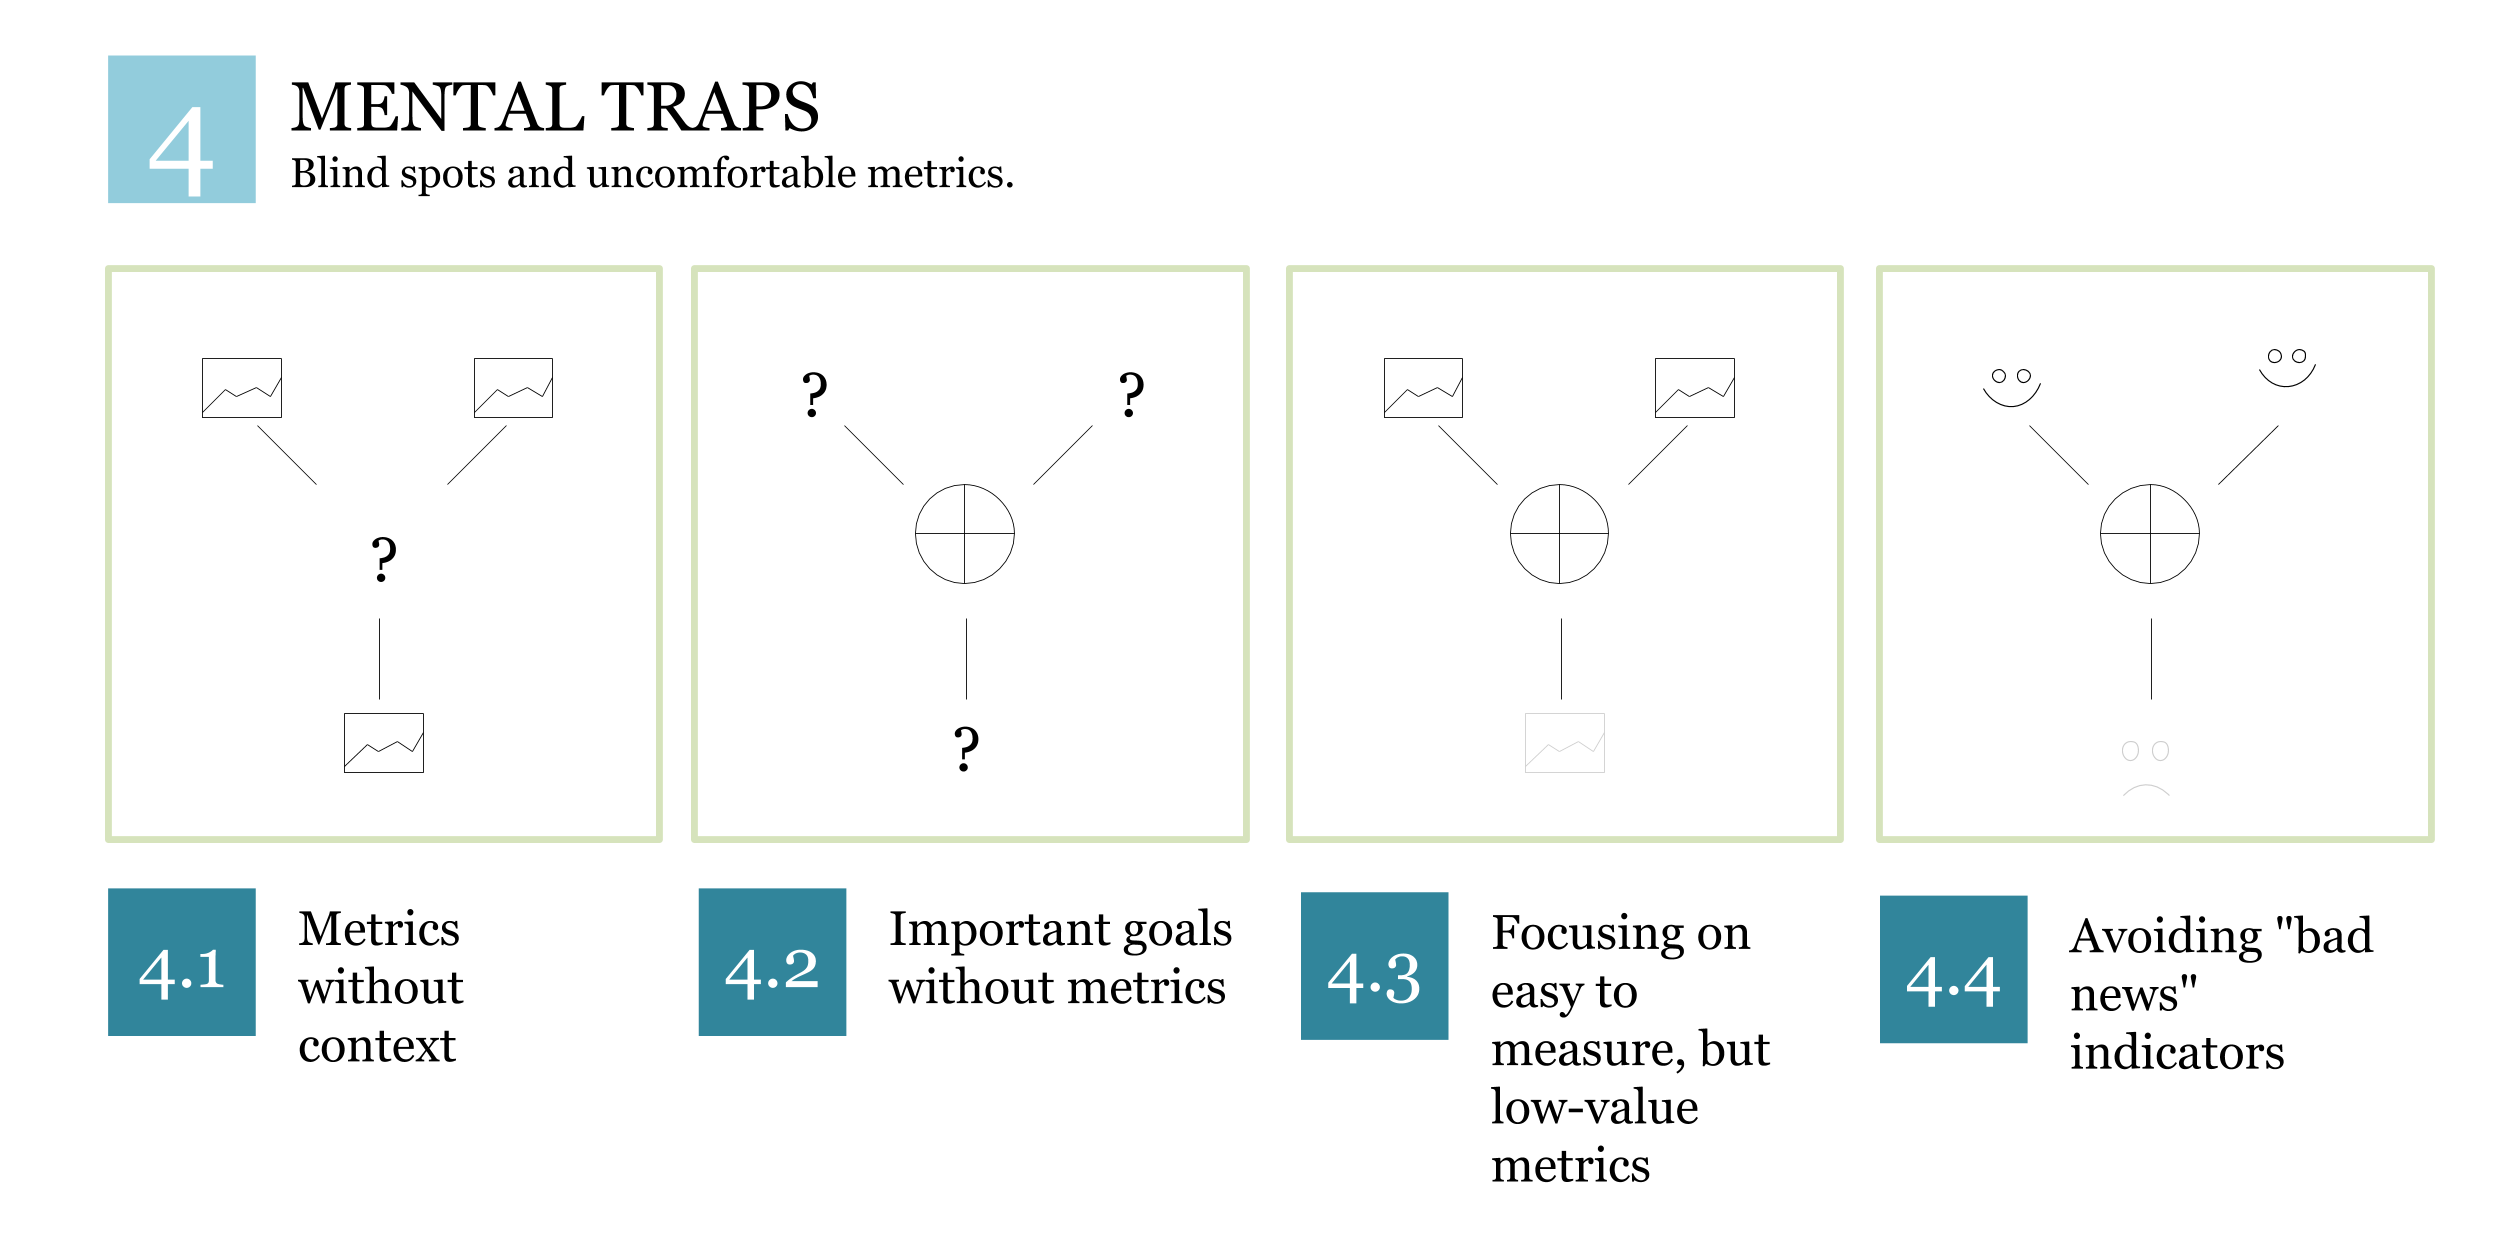
4.1 Metrics without context
If there is no goal that stands behind the metric, then this metric is useless in a business context. Remove it from your scorecard!
4.2. Important goals without metrics
Why don’t some of your goals have any metrics aligned with them? Let me guess, because it’s hard to find good metrics! The real reason is because the goal is not yet well defined. To define a big goal break it down and focus it as we did in Steps 1-3 for “immeasurable” software quality.
4.3. Focusing on easy to measure, but low-value metrics
Many read the previous section and decide to add some metrics to the goal in order to “pass the test.” If that’s your case, you are at risk! By adding easy to measure, but low value metrics you solve the problem temporarily; however, more valuable metrics stay unnoticed.
4.4. Avoiding “bad news” indicators
There are always some inconvenient metrics that people tend to ignore because they will bring too much of the red color to their nice scorecards and dashboard. For example, you know that the localization of the software in Chinese language is something outdated, so if you put a “Localization coverage, %” indicator on your dashboard it will be in the red zone for a long time before your team fixes it, so you decide simply… not to do that.
What would be a better approach in these cases?
- First of all, decide if users from China are the stakeholders (=buy the software; or have a potential to buy the software);
- If the answer is positive, then you can take it into account when prioritizing the business goals (see Step 8: Sorting metrics).
4.5 A solution for tough cases
Are there exceptions that cannot be easily quantified? Sure, there are! Sometimes the cost of measurement is too high compared to the value of measurement. If that’s the case, go to Step 6. Unknown.
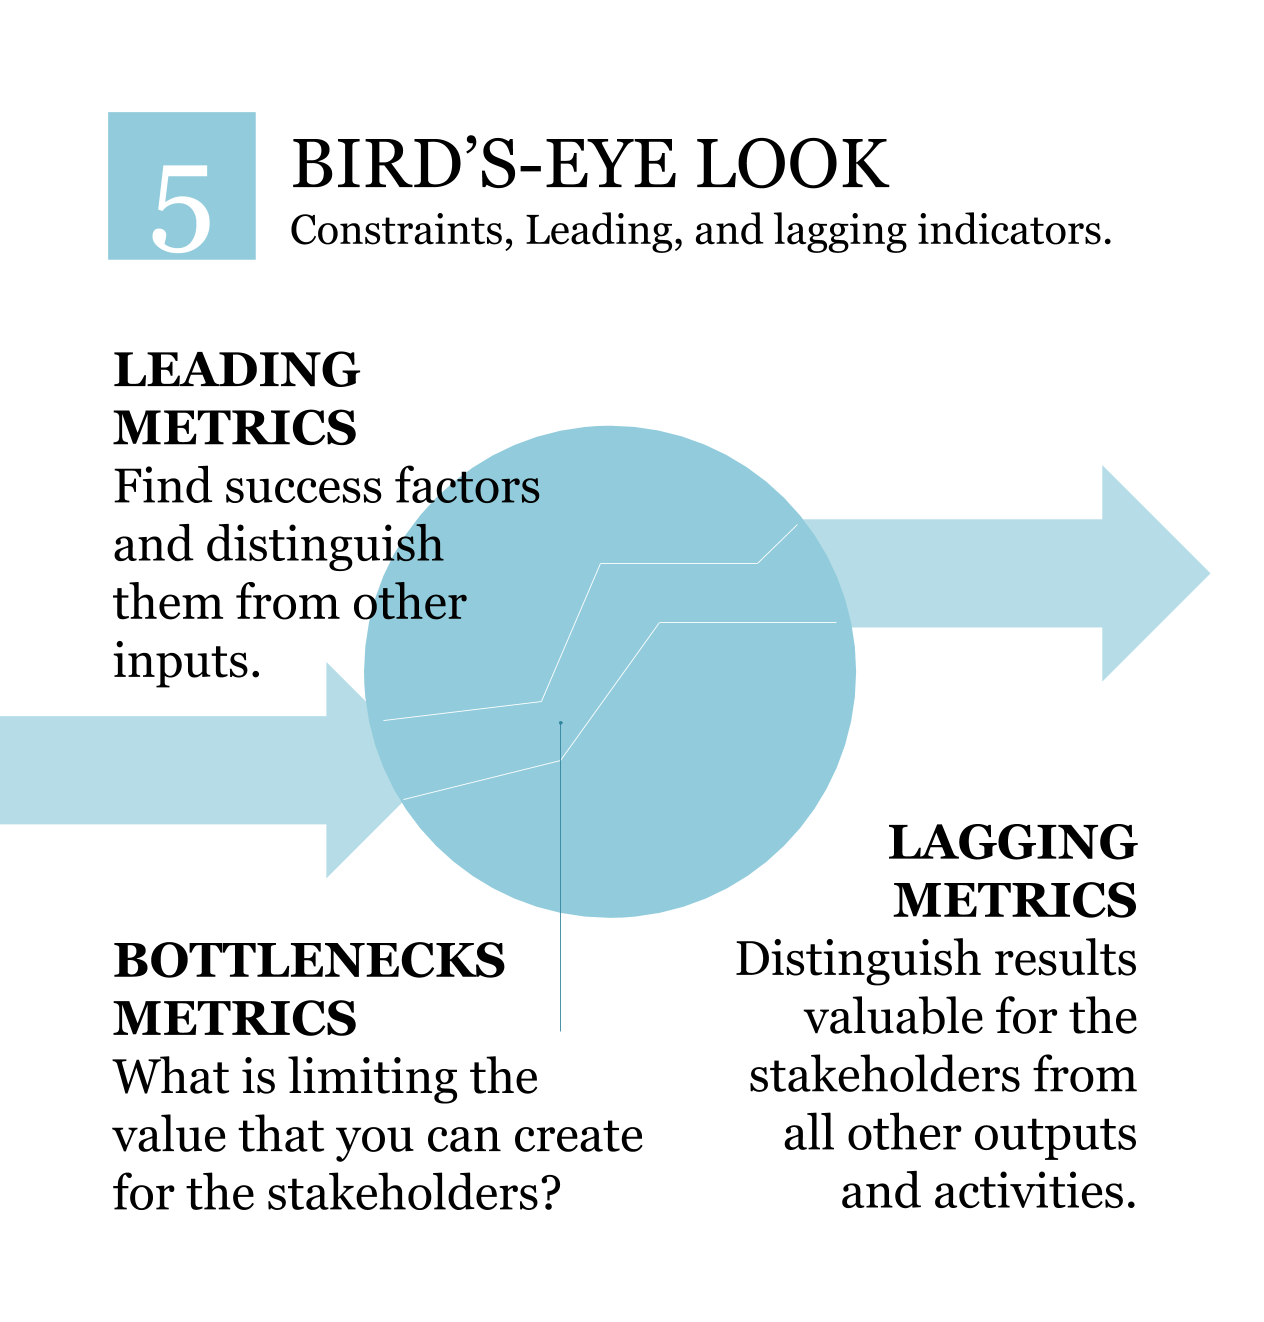
5. Bird’s-Eye Look. Constraints, Leading, and Lagging Indicators.
5.1. Leading and lagging metrics
By talking about metrics in a business context we can define leading and lagging metrics.
- Leading metric is the one related to the success factors; the one that helps to predict the success
- Lagging metric is the one related to the results that are valuable for the stakeholders.
Look at your indicators:
- What is a leading pair for your lagging indicator?
- What is a lagging pair for your leading indicator?
On this step, you will need to master your skills to:
- Find success factors and distinguish them from other inputs
- Look at the results from stakeholders’ point of view and distinguish valuable results from all other outputs and activities.
Learn more about Leading and Lagging indicators in this Q&A article.
5.2. Constraints or bottlenecks
Have a look at the business challenge once again. What is limiting the value that you can create for the stakeholders? Skip the obvious ones – time and money. The answer to this question will lead you to some good metrics related to the stakeholders’ value.
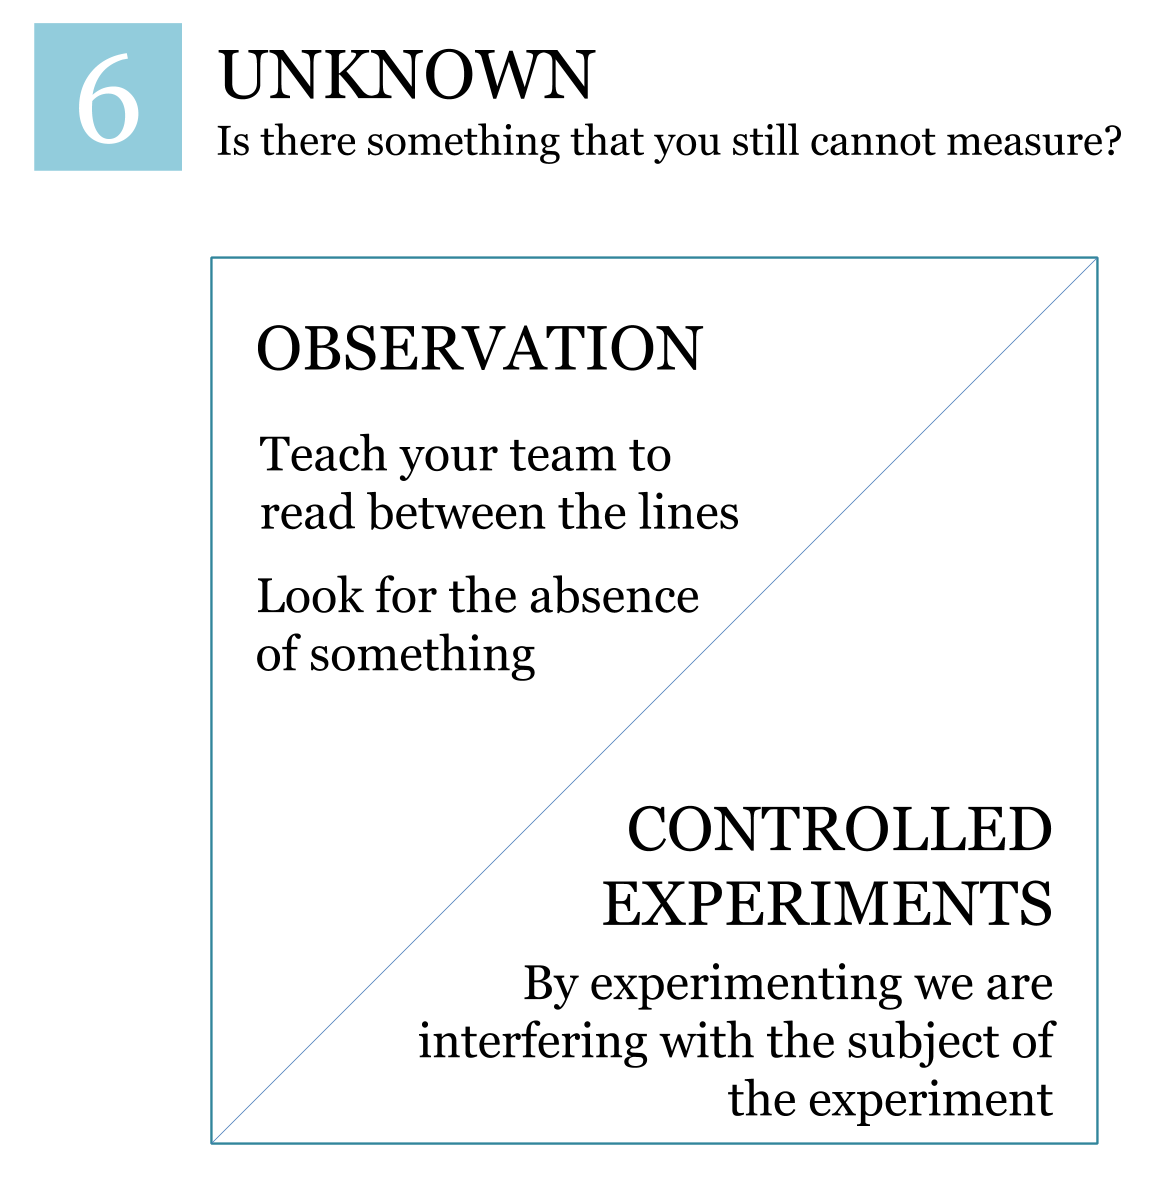
6. Unknown. Is There Something That You Still Cannot Measure?
 Sometimes you do the break down step, you know the stakeholders, you define the context, but it is still not clear how things work, and respectively, how to quantify and measure them. Have a look at Cynefin Framework. Most likely your case belongs to the “Complex” area.
What can you do in such cases? You have several options.
6.1. Observation
Don’t underestimate the power of simple observation. Most of the astronomical discoveries were made by observation only, no direct measurement, no physical interaction with the subject of measurement (except probably capturing the reflected light).
When talking to our clients over Skype we get a lot of interesting ideas by just observing their reaction, for sure your team needs to be able to read between the lines.
And it is not always about looking for something. Sometimes you need to look for the absence of something:
- In one of the stories about Sherlock Holmes the dog did not bark and that led Holmes to the conclusion that the evildoer was recognized by the dog (here is a longer story).
- In astronomy you cannot observe the black hole directly, but you can observe it indirectly via its influence on matter nearby.
6.2. Controlled experiments
The next step is the controlled experiments. Do what scientists do: establish certain conditions, see how your stakeholders will react, analyze, make the conclusions, and repeat the process again until you have a good understanding of what you need to do to satisfy the interests of the stakeholders.
Let’s take creative process as an example. One of the ways to measure it is to actually measure its impact. We do some controlled experiments, we try different designs and see if they work well in social media or in the maillist, and those controlled experiments help us to focus our creative process on what actually works.
Uncertainty principle
One thing to keep in mind: by experimenting we are interfering with the subject of the experiment, and this might have an influence on the results of the test (in quantum mechanics this is known as Heisenberg uncertainty principle).
7. Metric Setup. Scale, Formula, Weight.
Let’s say we measured the easiness to install the software, and we found out that on average it takes users 2 minutes 15 seconds to download, install, and run the software for the first time.
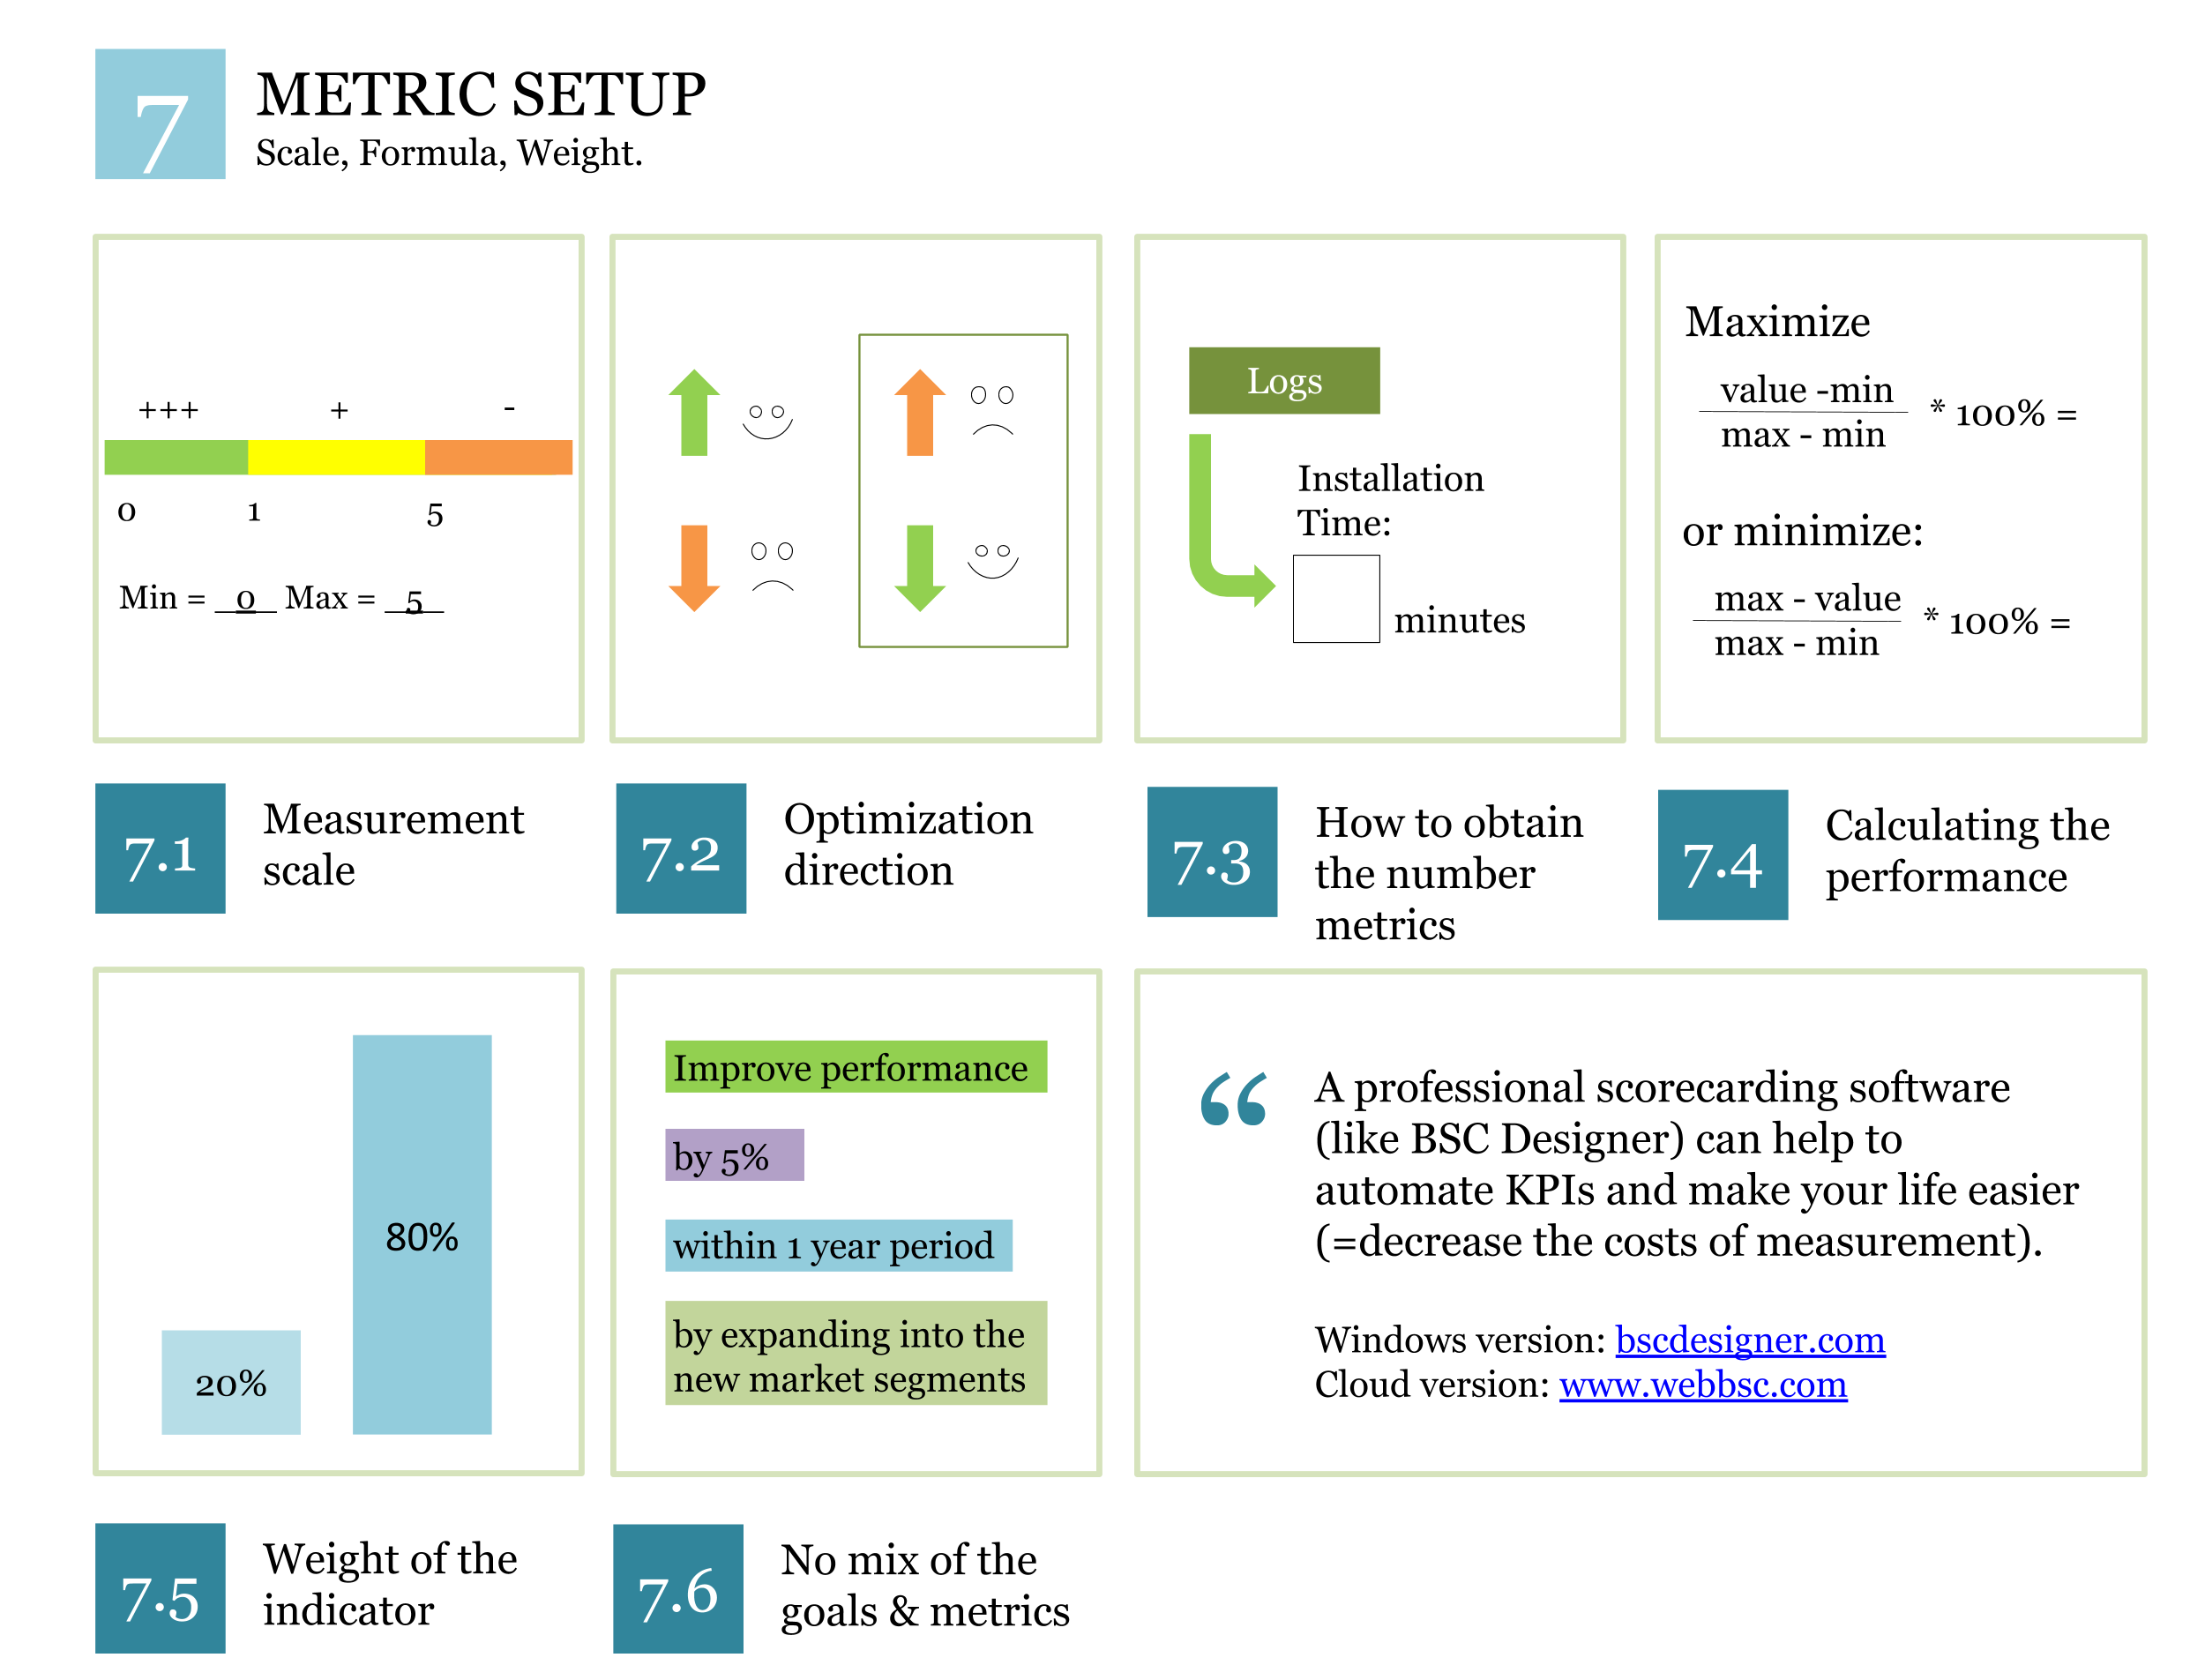
7.1. Measurement scale
What does this number mean? Is 2 minutes 15 seconds good or bad in this case? To answer these questions we can use some thresholds:
- How long does it take to install software of the competitors?
- How long did it take to install our software in the past?
A better question is one that is oriented on the stakeholders:
What installation time do users recognize as “fast” and what does “too slow” mean to them?
The goal is to get some scale that we can use for the measurement, let’s say:
- Below 1 minute – excellent
- Between 1 minute and 5 minutes – average
- More than 5 minutes – unacceptable
Now we know that with our 2:15 installation time we are in the “average” zone. The scale for the measurement might be from 0 to 5, and the measurement units will be “minutes.”
7.2. Optimization direction
What do you want to do with the value of the indicator? Do you want to maximize or minimize it? What’s our case?
- The higher the value of the indicator is the better the performance is, or
- The lower the value of the indicator is the better the performance is?
In this case we obviously want to minimize the installation time.
7.3. How to obtain the number
To make things more specific we need to define how exactly the installation time will be calculated:
- Should we take a random sample of users and ask them,
- Should we use an automated script,
- Should we analyze logs of the software?
Whatever method is used there should be a clear step-by-step algorithm (better to use a formula) to get the required value.
7.4. Calculating the performance
I have a question for you:
- What is better: “2:15 minutes installation time” or “2,000 visitors/day to a website?”
This question doesn’t make any sense. We cannot answer it, as measurement units are different (“minutes” and “visitors/day”).
To answers questions like this we need to normalize the values according to some type of scale and calculate the performance in %.
To do this we need to put the value (2:15 minutes) on the scale (0.5] minutes). Using a simple linear formula:
- [(max – value) / (max – min)]
We can calculate the performance of this indicator in %: it is 100%*(5-2,15)/(5-0)=57%!
7.5. Weight of the indicator
This step is optional if you have just a few indicators and their importance (strictly speaking of the importance of the goals that indicators are aligned with) is more or less the same. In the opposite assigning weights to the indicators is a good idea.
The weight of the indicator should tell us how the performance of this indicator contributes to the performance of the system.
For example:
- We have a customer support service where the performance is measured by the “Time to answer” and by the “Response quality.”
- Writing a quick answer to the email is easy (contributes to “Time to answer” metric); but it is more important to give a high-quality answer (contributes to the “Response quality” metric).
To reflect this idea we might want to assign a 20% weight to the “Time to answer” indicator and an 80% weight to the “Response quality” indicator. Then these weights can be used to calculate the performance.
You can try BSC Designer software for this purpose. Change the weights of the indicators and note how the performance of the container indicator is changing respectively.
7.6. No mix of the goals, metrics, and targets
I know goals like “Improve performance by 5% within 1 year period by expanding into the new market segments” look very S.M.A.R.T. as they are measurable, actionable, have a time limited, and whatever, but don’t do this for your scorecard, don’t mix:
- Goal (“Improve performance”)
- Metric (“Performance growth, %”)
- Target (“5% in 1 years”), and
- Action plan (“by expanding into the new market segments”)
The reasons and other recommendations were discussed in the KPI Q&As article.
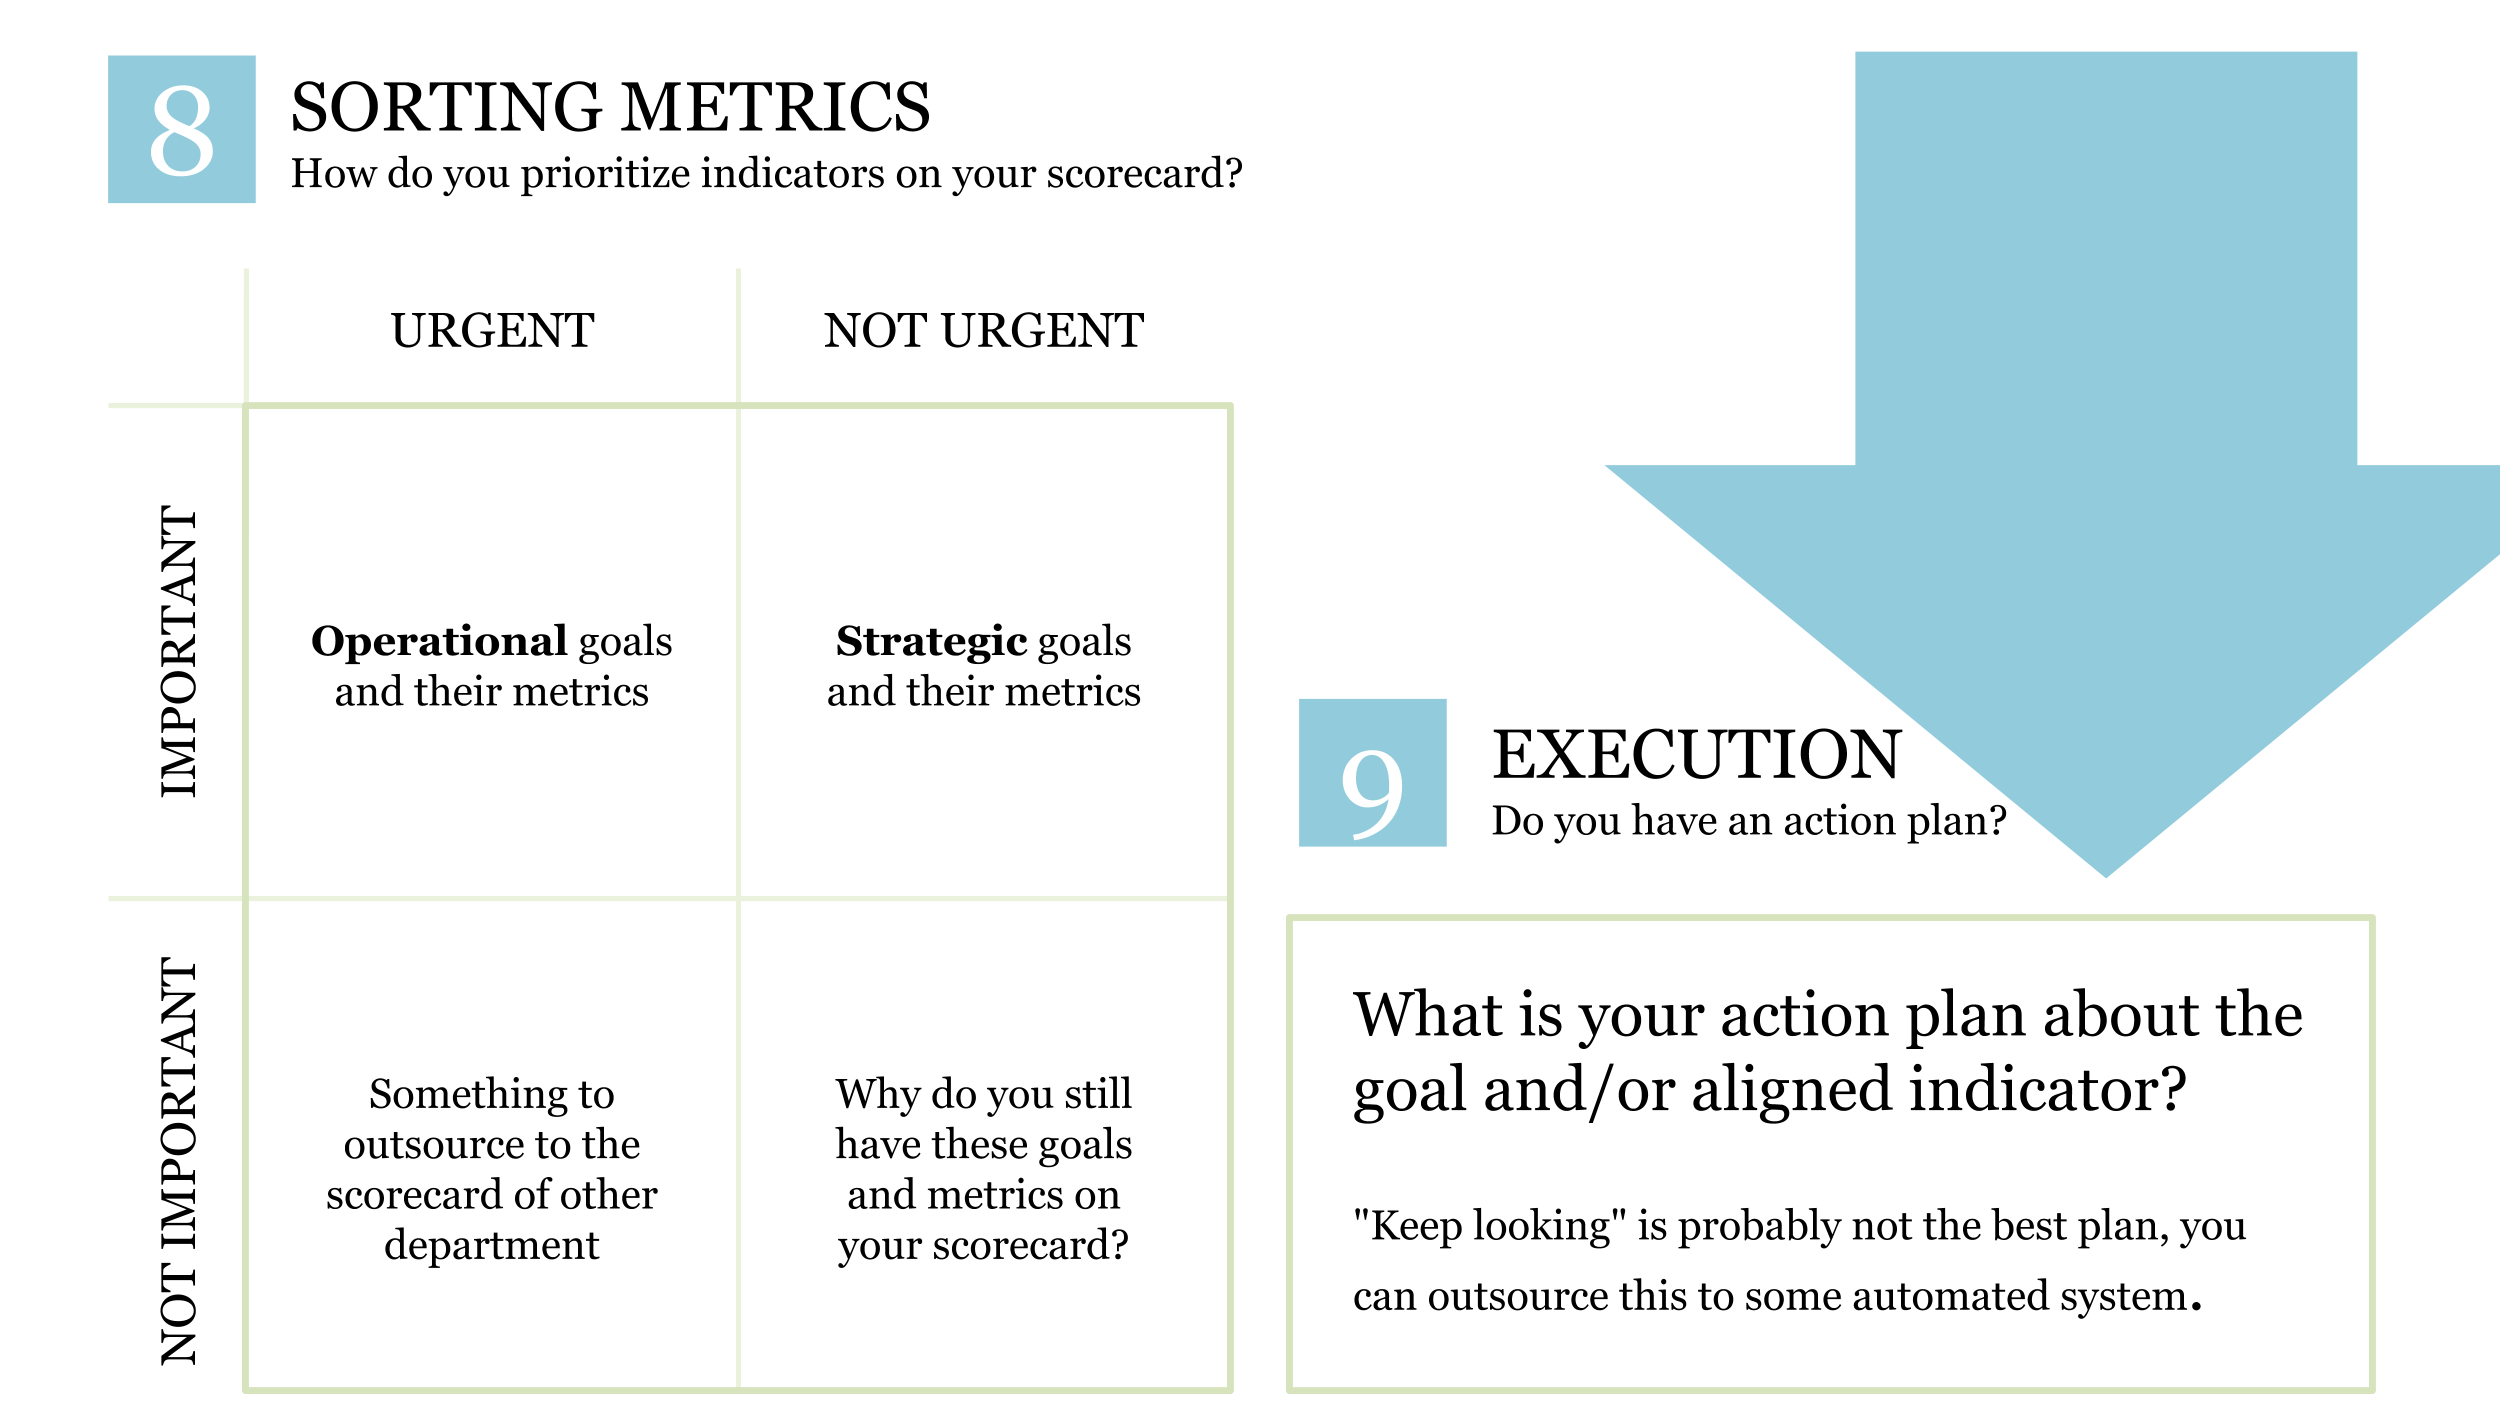
8. Sorting Metrics. How Do You Prioritize Indicators on Your Scorecard?
If you look at the indicators on your scorecard, do you feel like:
- You need all of them, and all of them are a high priority for you,
or
- There are some that you want to focus on right now,
- Some that are more relevant in long term,
- Some that are good to keep an eye on, but are not that important for your department?
First of all, it makes sense to review your business context once more (Step 3) and divide the goals into “operational” (those that imply improving on the best practices) and “strategic” (those that are change goals). The difference between strategic and operational was discussed here.
Now, let’s use Eisenhower’s matrix. We have two axis: “Importance” and “Urgency.” The “Importance” in this case means “Having a value for the stakeholders.”
I suggest to sort your metrics in this way:
- Important + Urgent: operational goals and their metrics
- Important + Not urgent: strategic goals and their metrics
- Not important + Urgent: something to outsource to the scorecard of other department
- Not important + Not urgent: why do you still have these goals and metrics on your scorecard?
This simple review gives you 4 basic scenarios for the metric:
- Put it on the strategic scorecard
- Put it on the operational dashboard/scorecard
- Outsource it to your colleagues, so that they would use it on their scorecards
- Remove it
This matrix is not perfect, but it is a good starting point.
9. Execution. Do You Have an Action Plan?
The performance measurement should be followed by the performance management. What is your action plan about the goal and/or aligned indicator? “Keep looking” is probably not the best plan, I’m sure you can outsource this to some automated system.
Have a look at the steps of the system that we had in the beginning. You agreed that this indicator is here for some purpose, so make sure that there is some tangible form of that purpose (=action plan).
10. Impact. What Behavior do Your Metrics Induce?
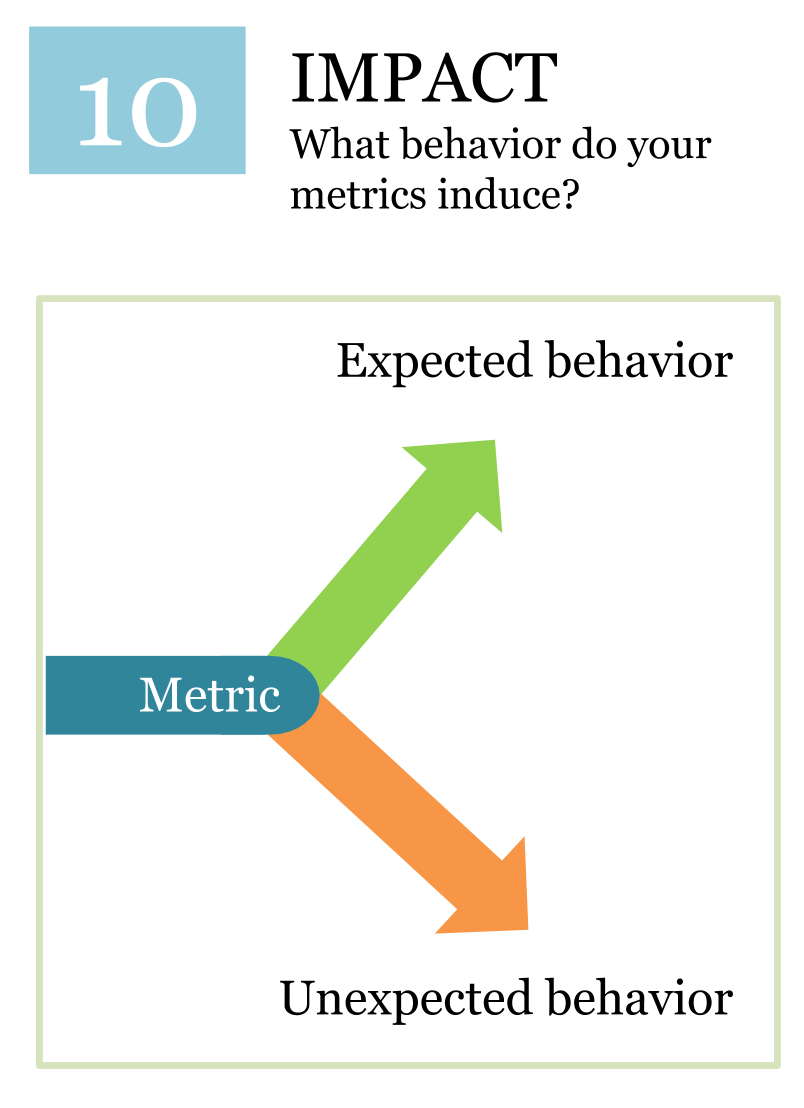 An international corporation had a goal – keep their employees healthier. Healthier employees mean less days off, and better productivity. The technical solution was quickly found: they gave everyone a wearable fitness tracker. What gets measured gets improved! Doesn’t it? To improve even more they decided to run a competition between several office teams. They were supposed to wear fitness trackers and count the number of steps they do daily. The team with more steps wins.
Great! Isn’t it? In practice many participants simply attached their tracker to their dogs in order to game the system and get a higher score. Was the initial goal achieved? Not exactly.
The main point: from time to time review your metrics to see what behavior they actually induce.
We talk more about KPIs misuse and share more cases in this article. Very often the problem is deeper that just one wrong metric. It is always good idea to look at the behaviour patterns (=culture) that lead to the undesired consequences.
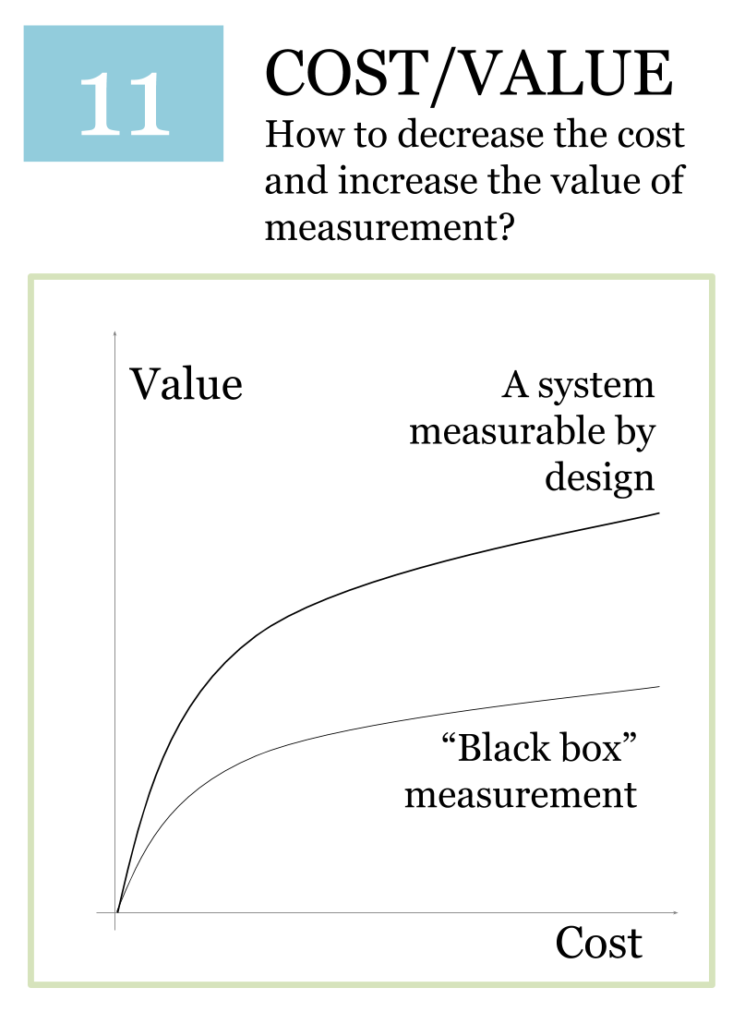
11. Cost vs Value. How to Decrease the Cost and Increase the Value of Measurement?
As it was mentioned before finding high-value metrics usually costs more that using low-value metrics. Here we discuss how to maximize the value and control the costs.
11.1. The cost of measurement
 Talking about the cost of measurement the key ideas are:
- If you want to control the cost, then the first step is to calculate it for the different measurement methods
- The more precise measurement is, the higher is the cost
- You can significantly reduce the cost of measurement if you think about the measurement beforehand (see the Step 11.3 Measurable by design).
11.2. The value of measurement
What about the value of measurement? People tend to focus on what is easier to measure. Why should one bother about measuring the quality of customer support (takes effort to measure) when it is so easy to track the “Time to response” metric?!
Consider the cost of measurement from the prism of stakeholder’s value.
- What metric will bring you closer to making your stakeholders happier?
- What’s the value of the measurement?
11.3. Control plan. Make systems measurable by design.
Imagine that you plan to attend a trade show with your product. How would you estimate the success of your participation?
The first things that come to mind:
- Collect business cards and put contacts into CRM
- Give out some discount coupons and track them back later
That might work for a smaller organization, but in larger companies due to the long decision-purchase cycle the results will be blurred over the time.
Key question to ask: what changes can you introduce into your system today to make it easier to measure the results tomorrow?
With a trade show example: suggest to all attendees to pass a free self-assessment test (automate it with a smartphone or a tablet). Those who participated will be your hot leads. Not only will the results be more tangible, but your colleagues from sales will have better leads to work with.
12. Automation. Will You be Notified if Something Happens?
 The last, but not the least. Updating and tracking your metrics manually rises the cost of the measurement (see Step 11) significantly.
A professional scorecarding software (like our BSC Designer) can help to automate KPIs and make your life easier (=decrease the costs of measurement). The software will help to:
- Set up KPIs with a scale, optimization direction, measure units, targets
- Calculate the performance in %, so that you could compare “money,” “visitors/day,” and “minutes” on the same scorecard
- Track the KPI over the timeframe
- Visualize information on the dashboards and strategy maps
- Set up alerts for the metrics
It is fine if now you use MS Excel, it works great in the prototype stage, but when the scale of the measurement changes, get a professional tool. When looking for a KPI tool, make sure you know the difference between KPI software and Balanced Scorecard software.
Examples and Questions
Here are some suggestions for your further research:
- Find some additional guidance in the KPIs Q&As article here.
- On bscdesigner.com you will find some specific examples of strategy scorecards with some relevant KPIs.
12 Steps vs. 10 Steps
A year after the “12 Steps KPI System” (the article and the infographic) were presented to the public, I wrote the book where the 12 steps were reduced to only 10 steps. Here is a short comment from the “10 Step KPI System” book about the reasons for that decision:
The first formal version of the KPI System appeared in 2014. It included 10 steps and a nice-looking one-page diagram that helped teams to brainstorm difficult cases. The next version included 12 steps: the additional steps were an explicit formulation of the breakdown, stakeholders, and business context steps, but very soon it appeared that the three separate steps looked nice on paper, but in practical use they did not make any sense. In the current KPI System you will find Step 1 with an introduction to these three concepts, all the supporting ideas are illustrated by the examples. I found that this form works much better for the readers.
The book is a very detailed analysis of the KPI domain, possible difficulties, and the ways to overcome them. As a bonus for the book, you will find a downloadable version of the KPI Template. Learn more about the book…
Download PDF Template + Example
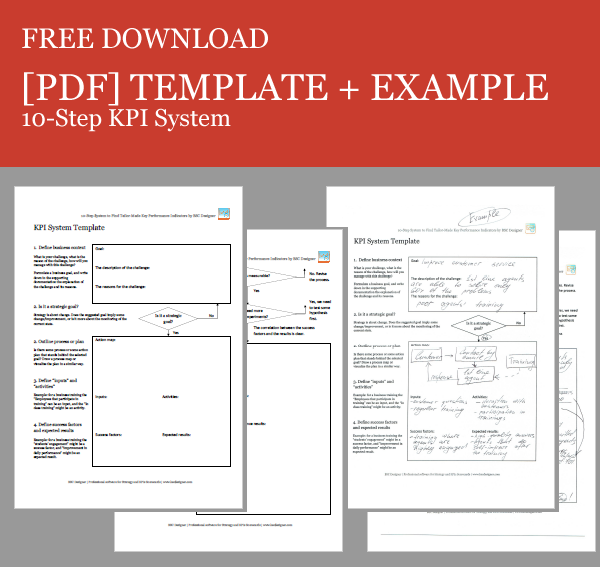
KPI Template
Follow these 12 steps to build a perfect KPI.
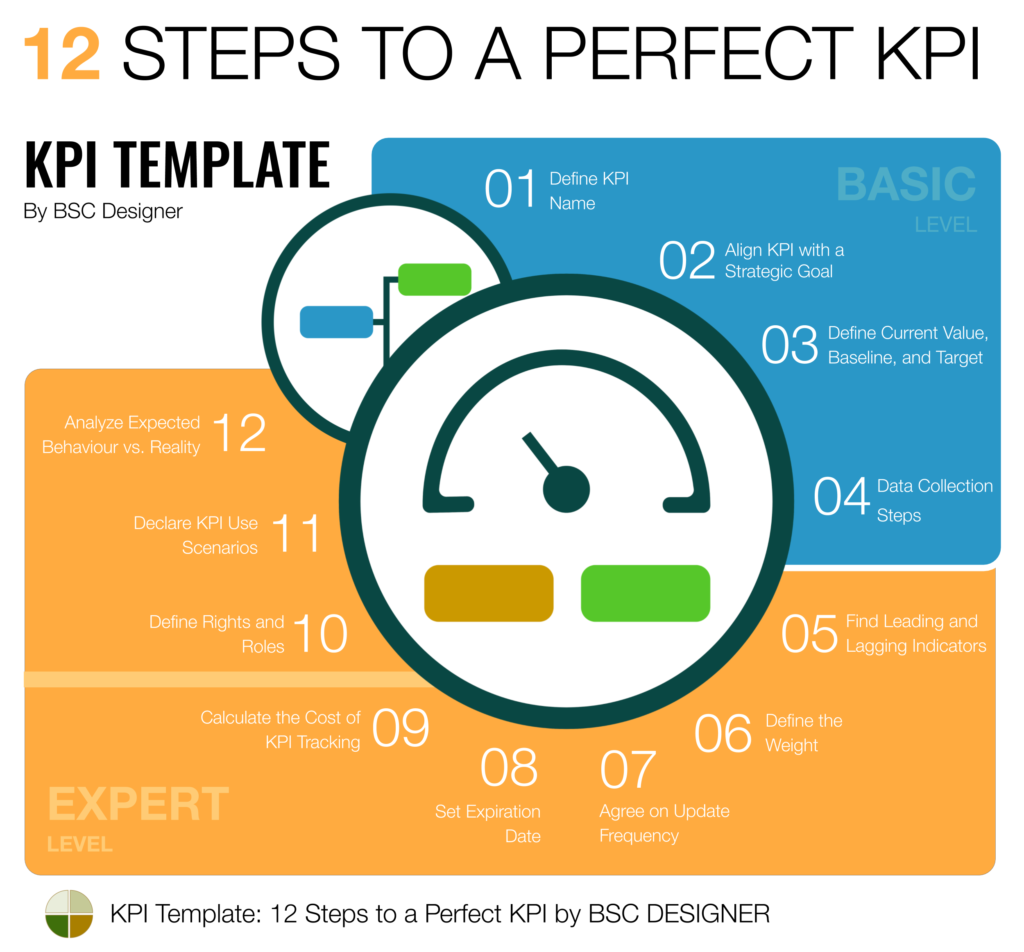
How to Define a KPI
Here is a short summary of the article that describes the steps to find a perfect KPI.
- Define the subject of measurement
- Define the stakeholders involved
- Understand the reasons for measurement
- Avoid easy to measure but low-value metrics
- Find bottlenecks, understand leading and lagging metrics
- Plan observations and experiments
- Setup metric scale, weight, performance formula
- Analyze induced behaviour
Your Feedback Needed!
I hope with the help of this system you will reinvent your scorecard and very soon it will become your favorite business tool for daily use. Please, share in the comments:
- What worked well for you?
- What can be improved?
Feel free to share your thoughts and ask your questions in the comments.

![]() CEO | Author | Speaker
CEO | Author | Speaker
BSC Designer is strategy execution software that enhances strategy formulation and execution through tangible KPIs. Our proprietary strategy implementation system reflects our practical experience in the strategy domain.
As you say, it is a tough task to find and implement good performance metrics. I have learned a lot from your articles. I can really relate to this article in particular. Thank you.
Remi, thank you for your nice feedback!
How to Get suitable kpi for cement industries ( construct tool for measuring performance using BSC to carry study on cement companies)
Mojamel, thank you for your question.
As in any other industry there are a lot of things to measure, and the first step is to decide what you want to measure (step 1 of the system), who is involved (step 2 of the system), and what is the purpose of the measurement (step 3 of the system).
If you are not sure about what to measure, then start with step 2 “stakeholders.” Prepare a long list of the systems and persons who have an interested in the business – contractors, clients, regulators, partners, HR, marketing, owners, etc. Think about the value that is created for those stakeholders, your indicators can be aligned with that value.
Thank you for your feedback
I want to measure the whole performance of public company which has three production plants to evaluate the effects of each aspect of BSC’s aspects to competitiveness abilities of company and plants comparing to its competitors
I suppose that the overall performance is built from key competentes of the company. The first step would be to brake-down the idea of overall company’s performance into smaller parts.
This is an excellent piece of work and demonstrates the gap in the measurement of executive performance in the current approaches.
Rawle
Very good information and article. Thank you very much.