Sales Backlog stands for the amount of sales orders that a company has received but has not completed yet, also referred to as order backlog or BI.
The perception of the impact backlog orders have on a company varies. The majority of companies measure their backlog rations in sales values. If the backlog sales value is high, this is considered very positive on the business, as it shows a high level of customer demand as well as future financial stability.

For example, if a phone manufacturer has a backlog of $200,000 worth of orders, investors consider that a positive figure that ensures a revenue a minimum sales revenue of $200,000.
Backlog – Positive or Negative Impact on Business?
However, if backlog is measured in days, this becomes a company performance matter. Here, most companies assess the health of the customer orders that are in Backlog (orders placed that have not been shipped out) relative to last week’s sales.
Research shows that a healthy backlog ranges between 1 day and 2 weeks, as it highly depends on the business and their performance objectives.
If a backlog decreases, this could be a sign of higher business performance or even a significant sales drop. For example, if more orders are processed daily per employee, this is definitely an improvement; however, if sales dropped, and the company is now focusing solely on delivering backlog orders, that is an alarming situation for the business.
Therefore, it is fundamental to analyze the backlog performance of your business and analyze how changes in backlog affect business success.
Sales Backlog Challenge
Company A aims to increase its backlog performance from an operational perspective and reach an ultimate goal of 1 day per customer order backlog.
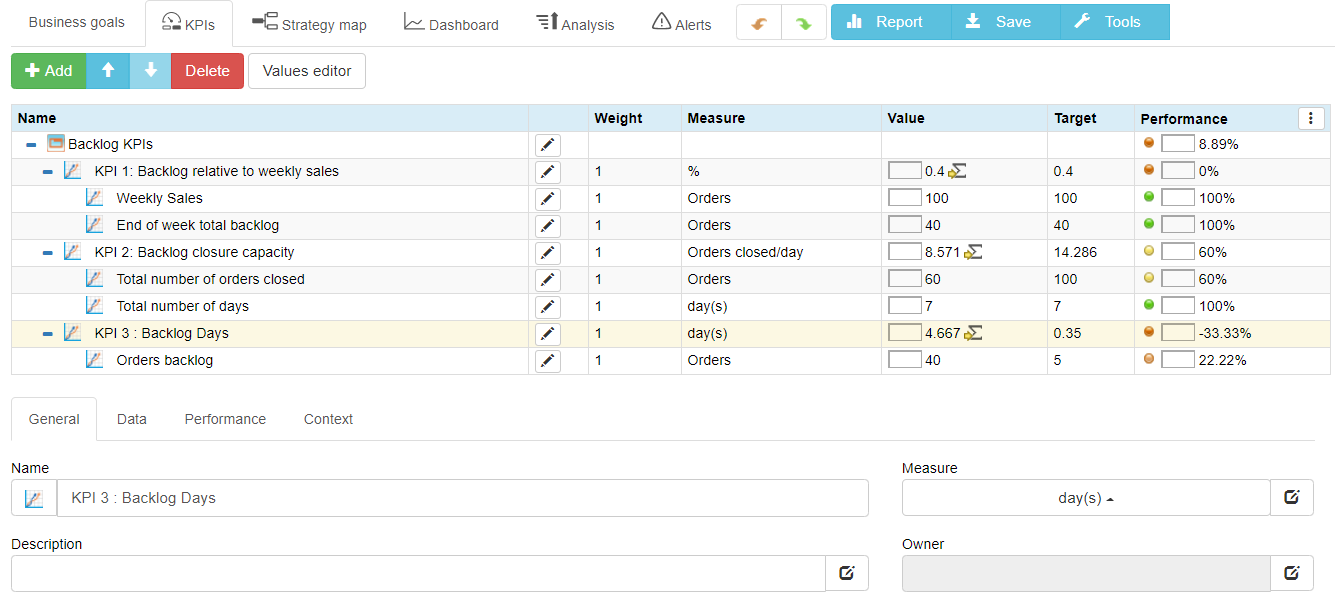
In order to achieve this, we put together a list of useful Key Performance Indicators and purposed a breakdown analysis to help Company A measure the performance success of their backlog management.
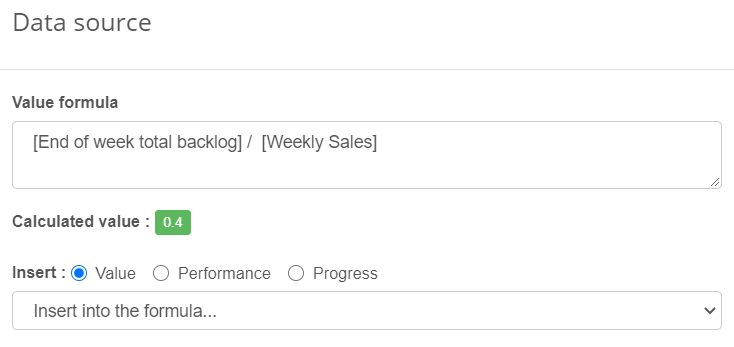
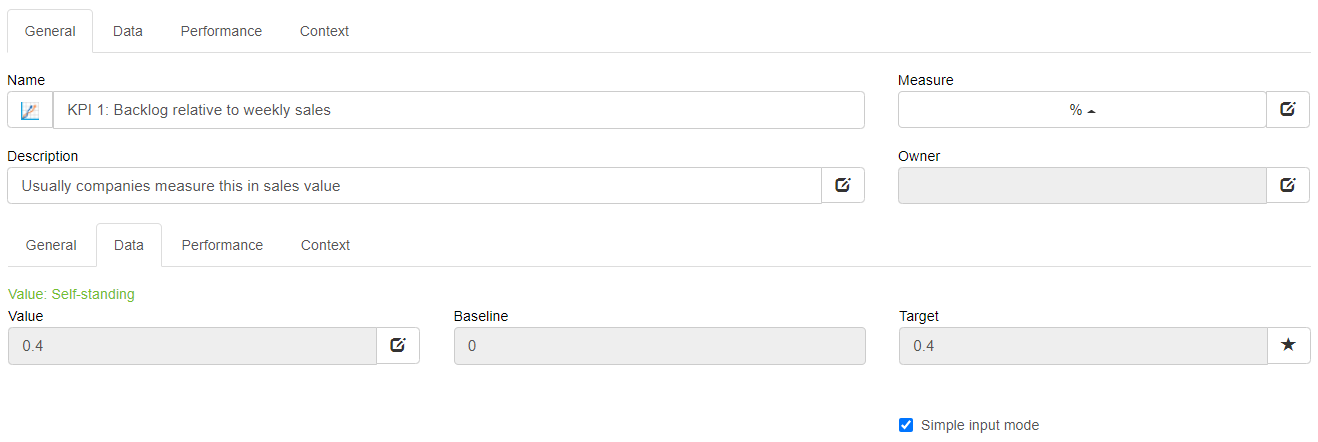
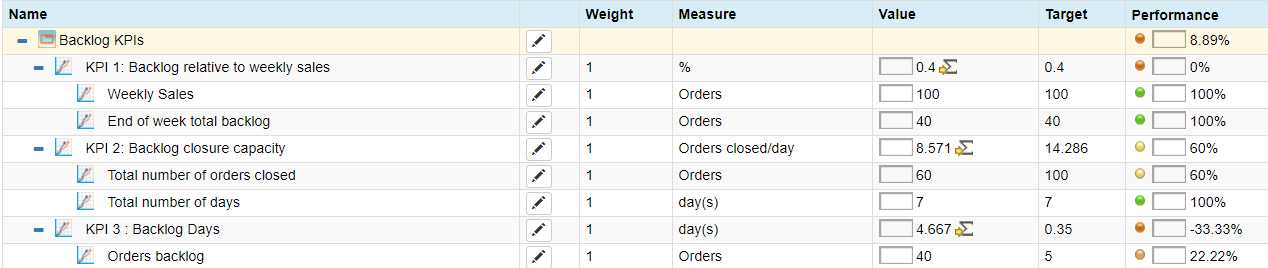
KPI 1: Backlog relative to weekly sales
- Formula: Total backlog (as of measurement day) / Weekly Sales
Hypothetical Example
- Date – 15h April
- Weekly Sales (8th-14th April) = 100 orders
- End of week total backlog = 40 orders
Backlog to Weekly Sales Ratio: 40/100 = 0.4: 1. Usually companies measure this in sales value.
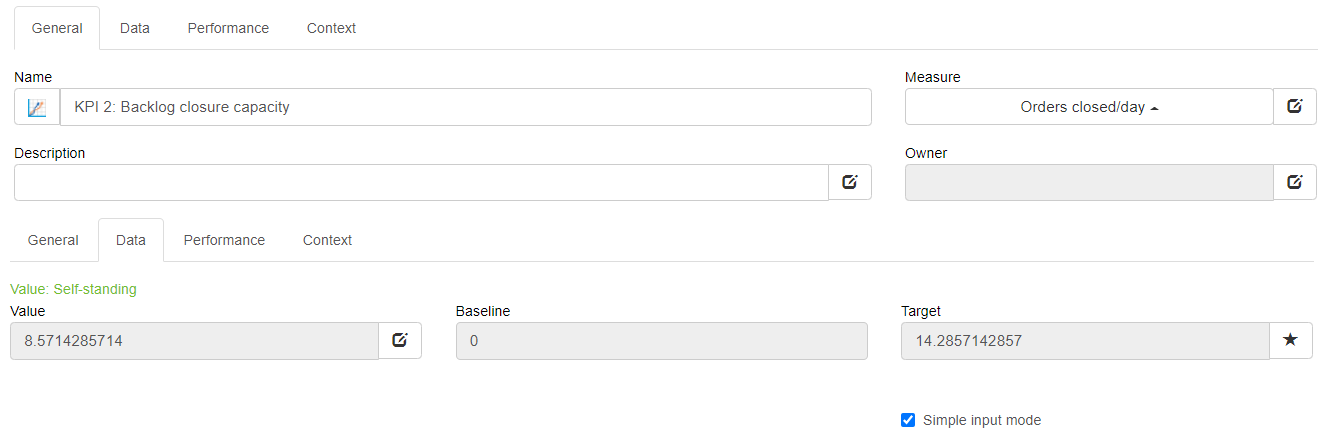
KPI 2: Daily order closure capacity
- Formula: Total number of orders closed/ total number of days (measured over given time period) e.g. 1 week (working 7 days a week)
Total number of orders closed: 60. Total number of days: 7. 60/7 = 8.5 orders closed per day
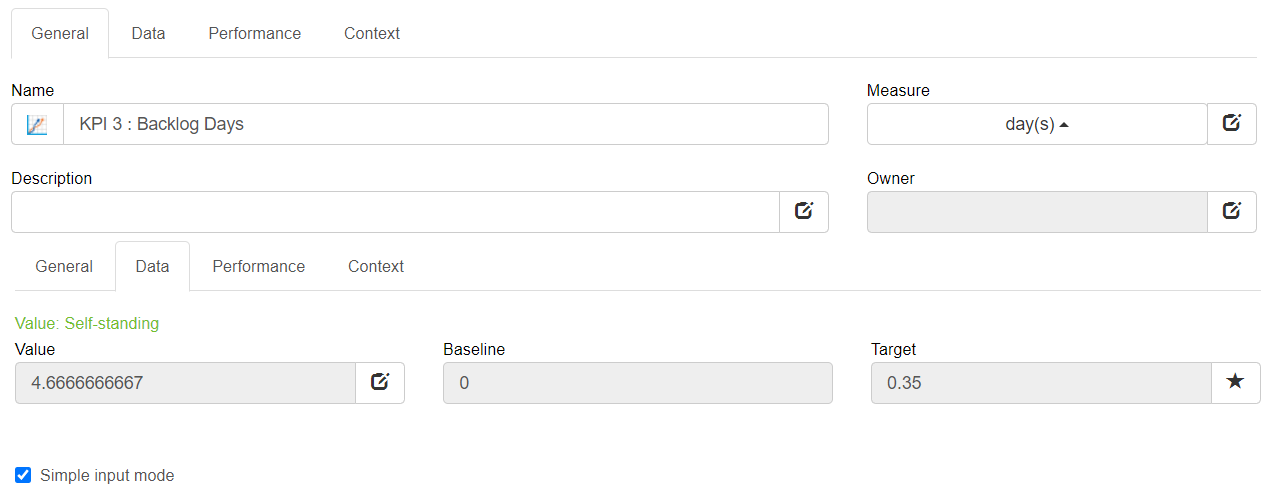
KPI 3: Backlog Days
- Formula: Total Open Orders as of measurement day (Orders backlog) / Orders Closed per Day (Order closure capacity)
Backlog Performance Analysis Breakdown
Case 1
Let us assume 40 orders backlog. The company receives weekly 100 orders and closes weekly 60.
- Backlog closure capacity: 8.5 orders per day.
- Total backlog: 40. 40/8.5 =4.7 days backlogged.
Backlog increases weekly if orders continue at this rate – because orders are higher than the company’s capacity to process orders.
Case 2
Weekly orders: 100. Weekly capacity: 60. 60/100 = 0.4. Ratio 0.4: 1 – for every order processed 0.4 are backlogged.
Figures at 21st of April look like:
Backlog at the start of the week + new orders – orders closed. 40+ 100 – 60 = 80.
- Backlog days : 80/8.5 = 9.4 days
Case 3
Let us assume the company increases the daily order capacity to 12 orders per day.
- Total open orders: 40
- Orders closed per day: 12
- Total open orders/orders closed per day
- 40/12 = 3.3 days backlogged
With a capacity of 12 orders per day, figures at 21st of April will look like:
- Formula: Backlog at the start of the week + new orders – orders closed
- 40+ 100 – (7×12) = 40 + 100 – 84 = 56
Backlog days:
- 56/12 = 4.6 days
The backlog will still be increasing because the company is working under capacity – either the company has to increase orders closure capacity over the weekly sales, or sales should decrease – the first option is preferred
Best Practice Advice
Best practice shows that the backlog should be measured against previous week’s sales, as this will show the backlog performance efficiency relative to sales performance.
However, if the company is working towards a target, in our case the 1-day backlog challenge, they could measure the current backlog against last week’s backlog. This will help to measure progress, such as % increase or % decrease in backlog days.
Automation software
If tracking backlog indicators is relevant to your business strategy, then consider using professional Balanced Scorecard software BSC Designer for this purpose.
On the one hand, you can use it to track your Key Performance Indicators and align them with appropriate action plans, and on the other hand, you can monitor your metrics (like, for example, backlog) automatically, and if it gets into the yellow or red zone, the person responsible will get a notification that something has gone wrong.
What's next?- Follow our
 Strategy Implementation System to align stakeholders, strategic ambitions, and business frameworks into a comprehensive strategy.
 - Automate strategic planning with BSC Designer by organizing goals, initiatives, risks, and KPIs into scorecards.
More About Strategic Planning


Oana Boteanu KPIs and Business Performance expert, she is a BA with Honours Management and Marketing graduate and has several years of experience working with performance management tools in employment performance and strategic performance. She also worked as a performance management online consultant at BSC Designer since from 2012 to 2013.