Learn about the best practices for building university scorecards and measuring various aspect of the performance with Key Performance Indicators (KPIs).
Key topics:
- A Basic Model of a University
- Stakeholders
- The Context of Measurement
- Ranking Systems
- What KPIs Do Other Universities Use?
- Finding Indicators
- Known Challenges
- Software Automation
In this article, we will discuss the subject and the purpose of measurement, and stakeholders’ involvement. We will analyze the indicators that are used by the ranking organization and the metrics that are popular on the dashboards of universities. In the end of the article we give away some templates and examples of the KPIs that one can use to start building a scorecard for their educational organization.
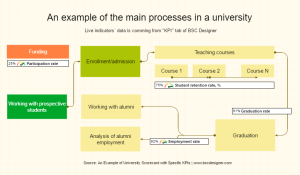
A Basic Model of a University. How Does a University Work?
All educational organizations are different: they have their unique values and specific approach to teaching. But at the same time, we can find some common features in any university. For the sake of further discussion, let’s start with building a visual model of the main processes in a university. According to our experience, this step helps to make the discussion about KPIs and strategy more efficient. If represented visually, the model looks like this:
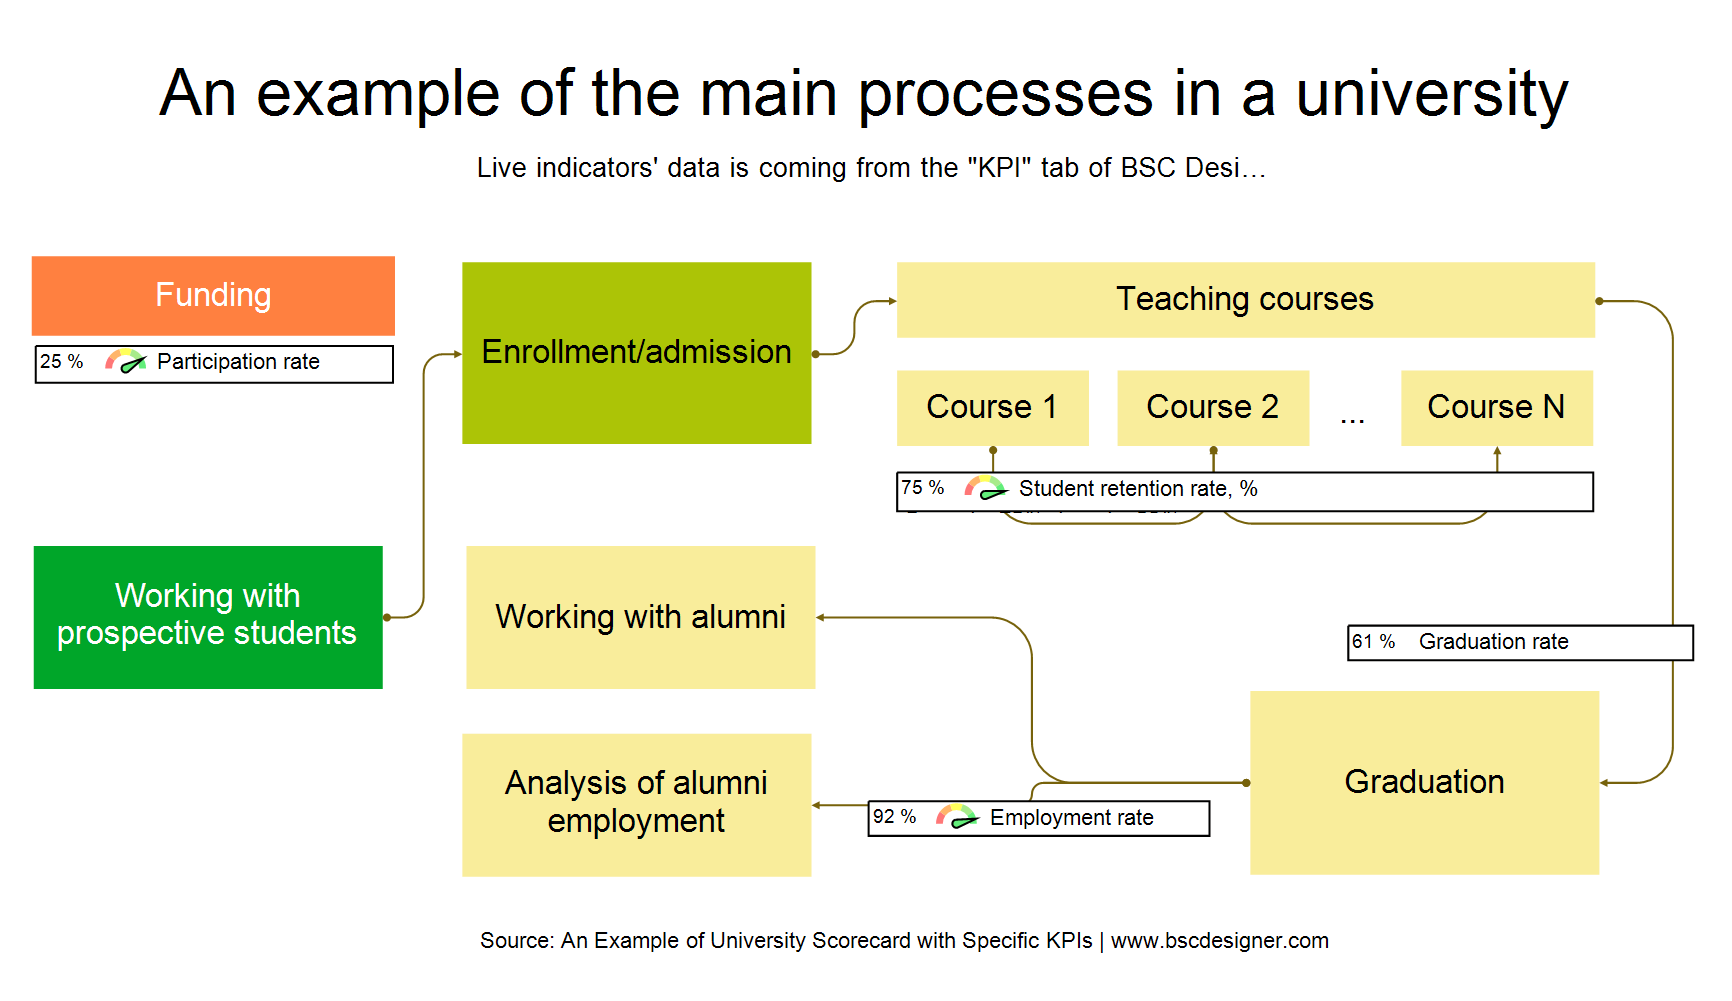
As you can see, the map also includes some performance indicators. These are the few “standard” KPIs that appear on the most university scorecards:
- Participation rate, %. The percent of representation of certain group of the population among students.
- Retention rate, %. Students retained in study as measured from course to course.
- Graduation rate, %. The percentage of the students who successfully completed their qualification.
- Employment outcomes. See “Ranking Indicators” section for specific details.
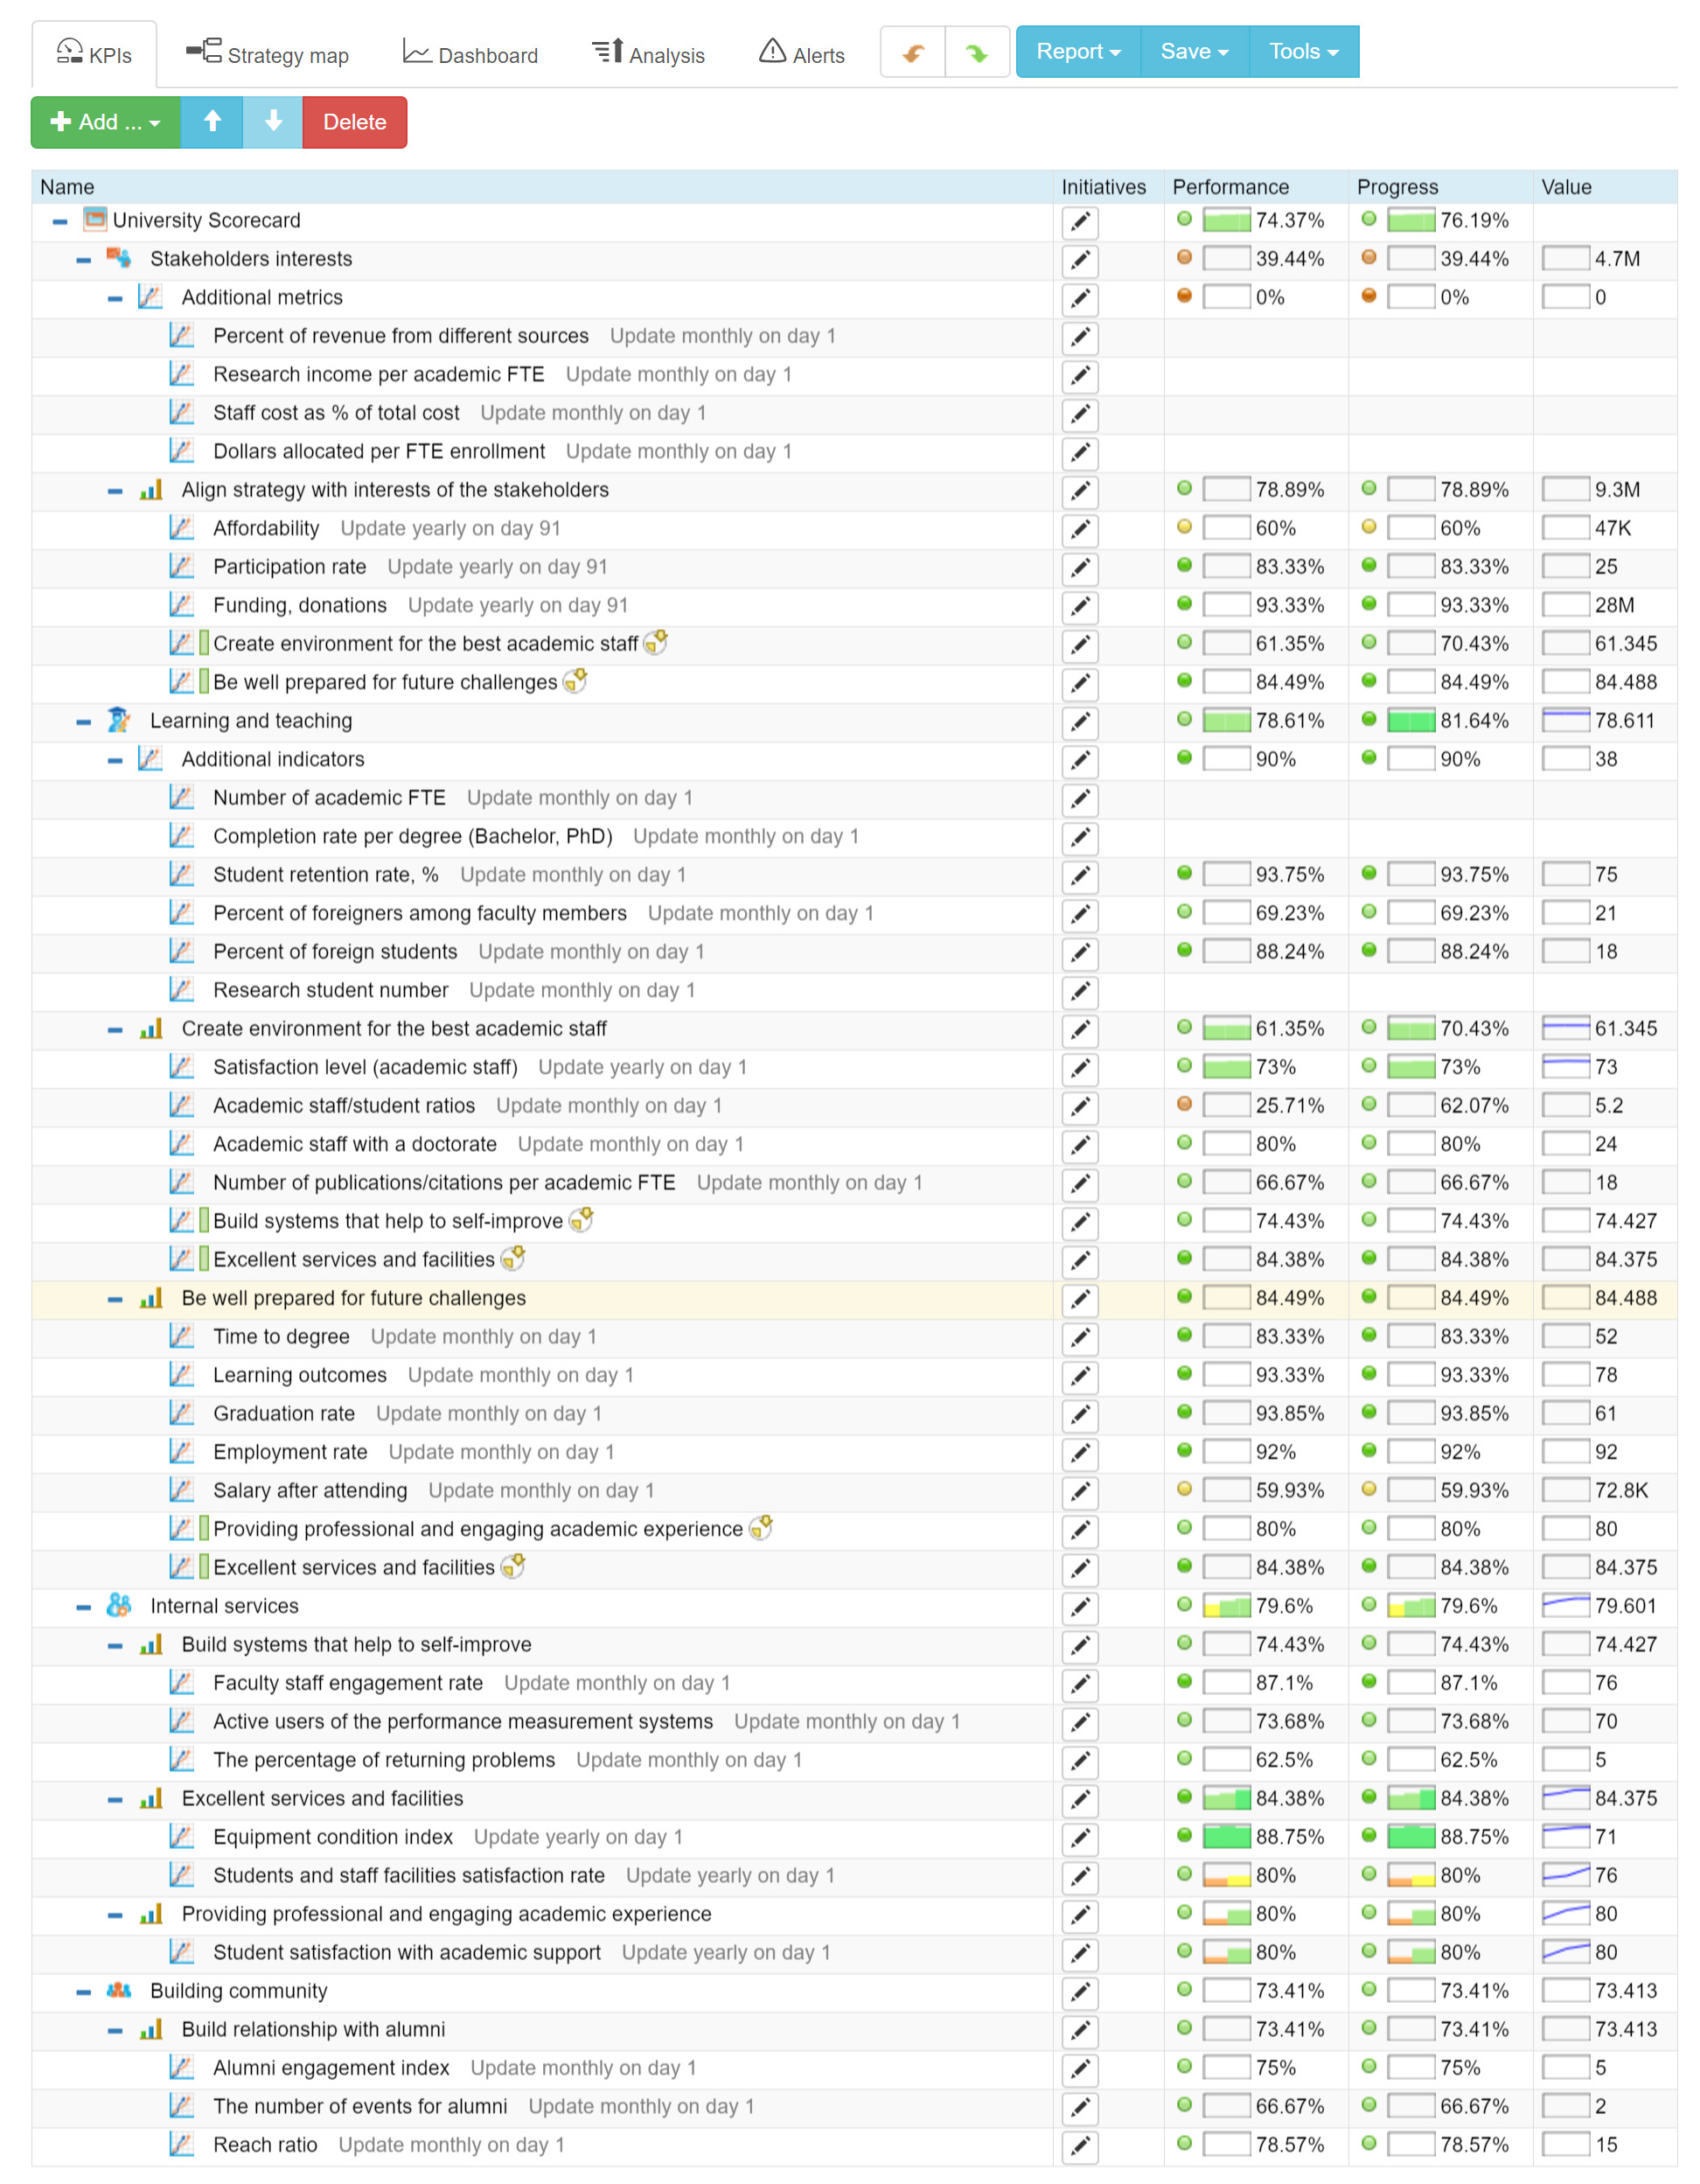
Here and below, to illustrate some of the ideas I will use the screenshots from the University Scorecard created with BSC Designer. This scorecard will be available for public access (see the links in the end of the article). You will find this process map on the “Strategy map” tab (be sure to switch between maps to access the right process map).
The Persons and the Systems Involved. Stakeholders.
Whose interests should we take into account when a defining strategy and performance measurement system for a university?
The main “client” is a student. A typical approach is to divide students into 3 groups:
- Prospective students and their families
- Current students, and
- Alumnus
Other stakeholders:
- Academic staff
- Professional staff (includes IT services, HR, library, etc.)
- Regulators and various state authorities
- Future employers
- Community members, partners, etc.
The Context of Measurement. What’s the Purpose of Measurement?
Before starting a performance measurement journey ask yourself these two questions:
- Why do we need a scorecard or the KPIs?
- What challenges do they help us (and our stakeholders) solve?
To answer these questions we can revise the list of stakeholders once more. By definition each stakeholder will have some interest in the subject of measurement. Just to name a few:
- Prospective students and their families, face a challenge of choosing the university. They need to have some benchmarks, some common ground for the comparison of the universities.
- Ultimate goal of the students is to be prepared for future. For example, they want to understand how their courses are aligned with what is required by the future employer, and what are their chances to get good employment after graduation.
- Professional staff need to compare themselves month to month and improve; they also need to justify a spending budget.
- A proper evaluation system will help academic staff to improve, and will help management to decide about any reward.
Learn more about surveys and the ways to improve them.
Start with Indicators from the International and Domestic Ranking Systems
Now we have the context for the measurement being defined, and the candidates for the KPIs are much easier to find.
Using Ranking Indicators as a Common Ground
The next step that I would recommend is to review measurement standards that already exist in your region. They are normally represented by various international and domestic ranking organizations:
College Scorecard by U.S. Department of Education allows one to find schools using such metrics as:
- Average annual cost,
- Graduation rate,
- Salary after attending
QS Top Universities also provides some good metrics to look at:
- Academic reputation
- Employer reputation
- Citations per faculty
- International student ratio
- Employability ranking
In some cases, the metrics, benchmarks, and respective measurement methodology are available publicly. For example QS shares the details about their methods for general ranking, as well as for the employability ranking.
Many universities use the position in such rankings as one of the performance indicators on their dashboards.
Two more recognized rankings are:
- THE (THE World University Rankings), and
- ARWU (Academic Ranking of World Universities)
At ARWU website one can find references to other global and national ratings.
The Problem with Indicators Used for Ranking
On the one hand the rating metrics do their job. They serve as a common ground for the benchmarking; they help prospective students to shortlist universities, and help funding organizations to support their decision.
On the other hand, a university is not a production line. Standard metrics won’t take into account many intangible values. The metrics from the rankings are too general and as a result are not that useful for month to month self-improvement process.
- For example, a popular citation index is not well accepted in some countries1, and it makes perfect sense, as excellence in research and education should not be counted just by the number of the publications.
- Another example is employability, while it is one of the key metrics in English-speaking countries, but in other countries it is not so popular. For example, in Russia 2 employability indicators are not explicitly used on the dashboards of the top universities.
On that point management needs to decide on a tailor-made performance management system that would track key parts of a university’s strategy execution.
Common Practices. What KPIs Do Other Universities Use?
Below you will find references to the studies of the performance indicators in the education sector. On the one hand, these studies give us an idea about what metrics are being used, on the other hand, they confirm that there is no common performance measurement framework for the universities.
Indicators Shared by Most of the Universities
J.C. Burke and H.P. Minassians in their study 3 reviewed public performance reports of the universities and found 158 distinct performance indicators. Among those indicators they have found 8 indicators that were shared by more than 50% of reviewed organizations, those 8 were:
- Graduation,
- Enrollment,
- Sponsored research,
- Student transfers,
- Tuition,
- Financial aid,
- Degrees awarded,
- Licensure test scores
Areas That Are Measured by Most of the Universities
Another research was done by Dawn Terkla 4. She analyzed the dashboards of 66 colleges and universities and categorized her findings.
The most popular (found on more than 50% of the dashboards) areas of measurement were:
- Endowment & Expenses Data, Advancement, Financial Aid Figures
- Admissions Scores
- Enrollment Figures, Enrollment Figures (Special Populations)
- Faculty-General (such as Faculty FTE, % of faculty with terminal degree)
- Graduation Rates, Retention rates,
- Student Engagement
- Student/Faculty Contact
Finding Indicators for University Scorecard
What indicators should universities use then? The best idea is to design tailor-made KPIs. To support this creative process we have a 12-step system for challenging KPIs that anyone can use. The example below demonstrates an approach that one can use to build a scorecard for a university.
Prepare Perspectives for the Indicators
Having a long list of metrics is not enough for efficient and effective performance management. It is important to:
- Align those metrics with specific goals and initiatives, and
- Show how those goals form a coherent strategy.
For this purpose many for-profit organizations use the 4 perspectives suggested by the Balanced Scorecard approach. In the case of the educational organizations, there is no such agreement. Universities are trying to capture their unique values and strategies in various ways, respectively the names of the perspectives vary.
For example, University of Greenwich in their Strategic Plan document 5 grouped their KPIs into the 4 perspectives that will make a lot of sense for most universities:
- Education (outstanding learning and teaching)
- Research (being world-class research and knowledge exchange center)
- Community (supported by various programs for the students)
- Services (excellence in services and infrastructure)
Another popular option is to use perspectives derived from MBQA (Malcolm Baldrige Quality Awards) model as applied to education 6. These perspectives can be formulated as:
- Strategic
- Budget
- Career
- Information services
Below you will find my suggestions for the perspectives. If you are familiar with the Balanced Scorecard approach you will find that their names are different (changed according to the needs of the educational domain), but the cause-and-effect logic can still be tracked:
- Stakeholder interests
- Learning and teaching (goals related to the students and academic staff)
- Internal services (goals related to the supporting services like IT, HR, Library, etc.)
- Building community (goals related to building relationship with alumni and community goals in general)
Whatever approach you prefer, be sure that your perspectives are not just simple containers for the indicators, but they help to describe the cause-and-effect logic of your strategy (see Known challenges section for more details).
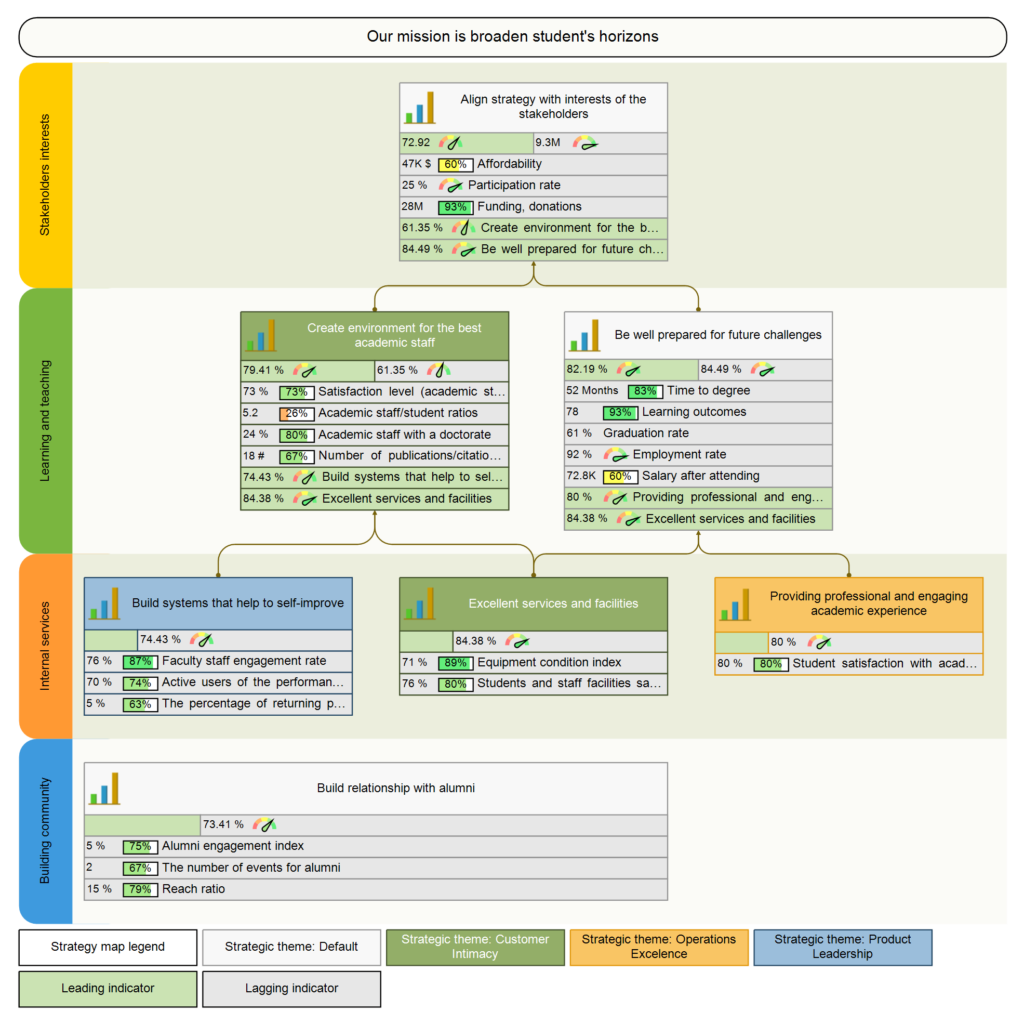
Building Strategy Map with KPIs for a University
Universities have to balance their strategies between the requirements implied by the funding, academic, and community needs. Below you will find an example of a strategy map for a university that you can use as a starting point for building your own strategy map.
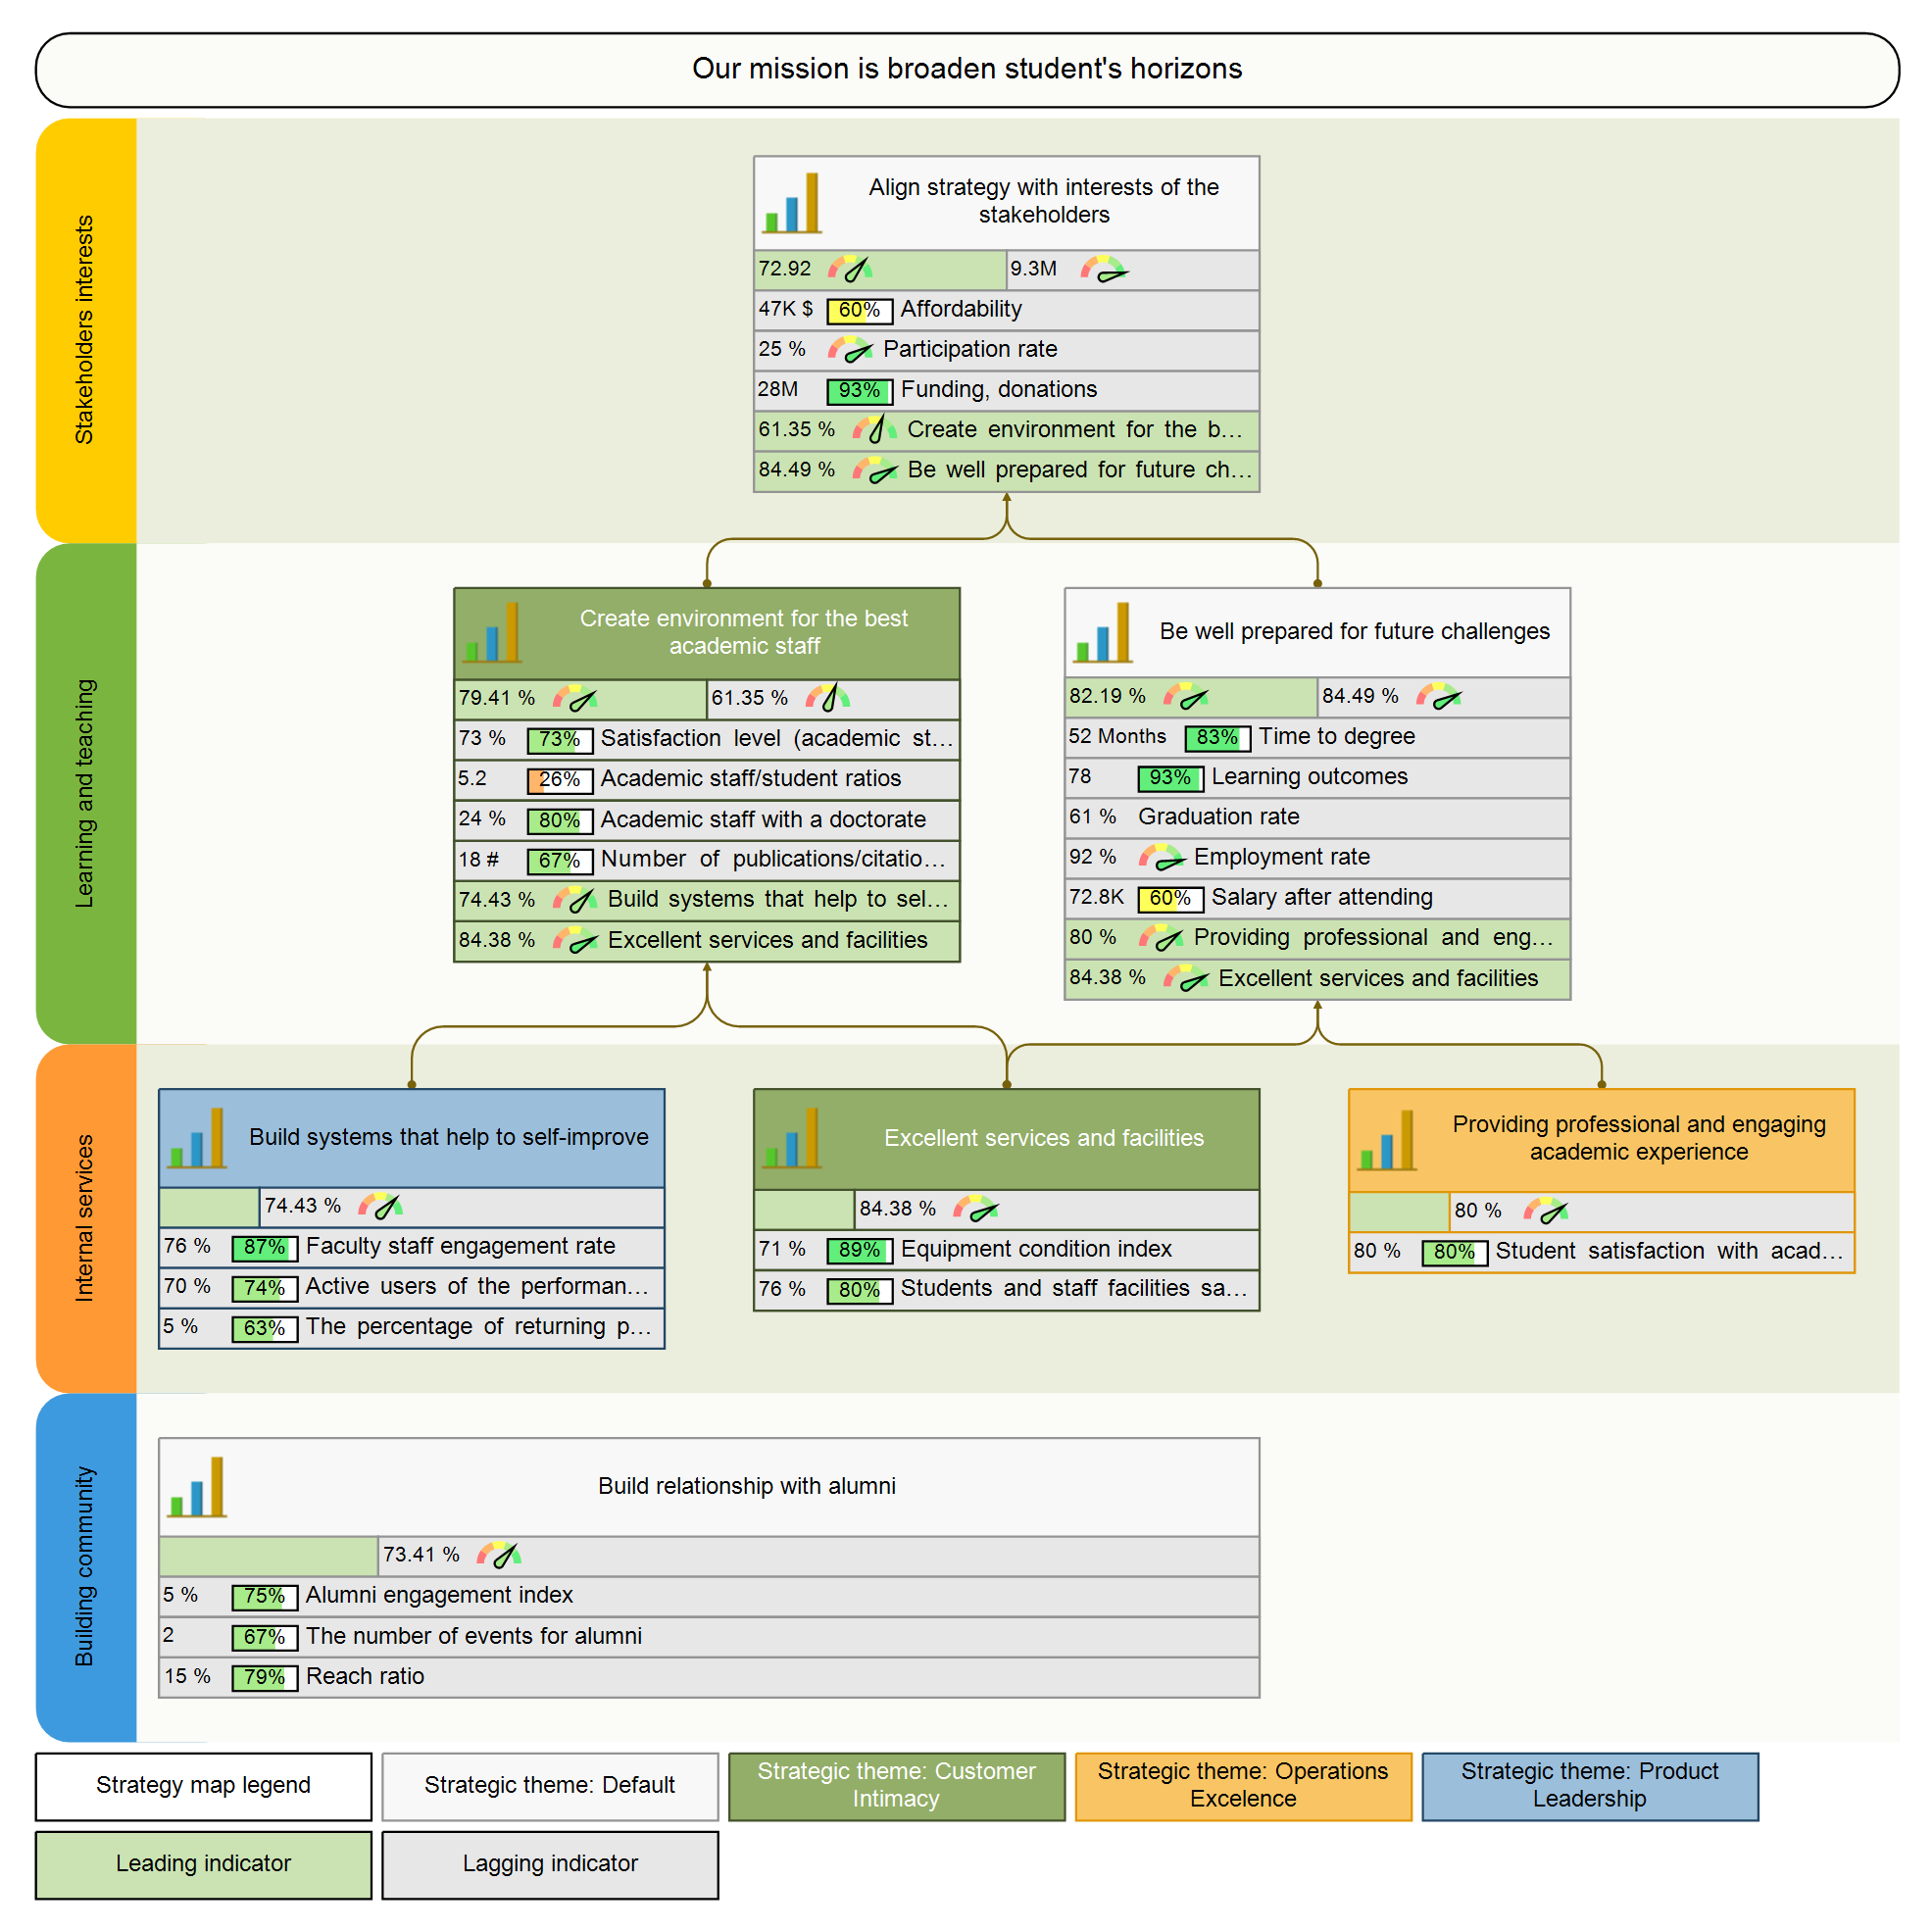
Mission: broaden student’s horizons. Learn more about formulating mission statement.
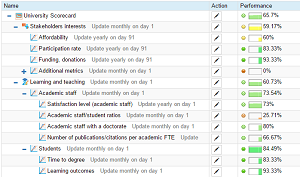
Stakeholders Interests
- Goal: Align strategy with interests of the stakeholders
- Leading indicator: Affordability (tuition and other fees compared with average family income)
- Lagging indicator: Participation rate, % (the percent of representation of certain group of population among students)
- Lagging indicator: Financial aid, funding, donations, etc.
Additional metrics that might fit in this perspective:
- Percent of revenue from different sources, %
- Research income per academic FTE
- Staff cost as % of total cost
- Dollars allocated per FTE enrollment
Learning and Teaching
- Goal: [Academic Staff] Create environment for the best academic staff
- Leading: Satisfaction level, %
- Leading: Academic staff/student ratios (data for benchmarking can be found THE)
- Lagging: Academic staff with a doctorate, %
- Lagging: Number of publications/citations per academic FTE (number of publications/citations according to Web of Science and Scopus)
- Goal: [Students] Be well prepared for future challenges
- Leading: Time to degree (some data by National Center for Education Statistics for benchmarking)
- Leading: Learning outcomes
- Leading: Graduation rate, % (the percent of the students who successfully completed their qualification)
- Lagging: Graduate employment rate (or more pragmatic “Salary after attending”)
Additional indicators:
- Number of academic FTE
- Completion rate per degree (Bachelor, PhD)
- Student retention rate, % (measured from course to course)
- Percent of foreigners among faculty members
- Percent of foreign students
- Research student number
Internal Services
- Excellent services and facilities;
- Leading: Equipment condition index
- Lagging: Students and staff facilities satisfaction rate
- Lagging: International students / Total students
- Build systems that help to self-improve;
- Leading indicator: Faculty staff engagement rate
- Lagging indicator: Active users of the performance measurement systems
- Lagging indicator: The percentage of returning problems
- Providing professional and engaging academic experience;
- Lagging indicator: Student satisfaction with academic support
Building Community
- Relationship with alumni. Build relationship with alumni to help new generations of students with their challenges.
- Lagging indicator: Alumni engagement index (alumnus participated in events / alumnus reached)
- Leading indicator: The number of events for alumni
- Leading indicator: Reach ratio, % (alumnus reached via any contact mean vs. total number of living alumnus)
All of the indicators can be further developed. For example, more details can be added to the alumni indicators, for example profiling alumnus into those who replied to the message sent, who sign-up for events, who actually participated in the events, who signed-up for volunteering, and actually volunteered (speaking on events, mentoring students, etc.), who became a sponsor, etc. It makes sense to look separately at domestic and international alumnus.

Strategy Map Wizard – Balanced Scorecard in 6 Minutes
Answer simple questions - build a professional strategy map in 6 minutes.
Strategy formulation and description might be a time-consuming project even for an experienced strategist. This Strategy Scorecard Wizard will make the whole process fast and intuitive.Known Challenges
Using Perspectives as Simple Containers for the Indicators
A typical case for many scorecards is when the perspectives work just as containers for the metrics. University scorecards are not an exception: the perspectives are often used to group the performance metrics into different silos, but not to explain the cause-and-effect logic.
In many cases the cause-and-effect is implied on the earlier stages of the strategy definition, but is not properly reflected on the scorecard. To avoid this, visualize the cause-and-effect logic directly onto the strategy map.
Focusing on What Is Easy to Measure, but Missing What Is Important
On a typical dashboard of a university there are various versions of easy to measure metrics such as “student retention” and “graduation rates,” but only a few features hard to measure “employability” indicators.
When choosing new indicators one needs to think about the cost and the value of the measurement. While the cost of measuring employability is high, the value for the prospective students and other stakeholders is also significant.
Below we discuss how one can do better in such cases.
Surveys Give Us Indicators That Are Lagging in Their Nature
Have a look at the indicators on your scorecard: detect indicators that are based on students or faculty staff surveys. These indicators have some potential problems:
- By doing surveys you are interacting with the subject of measurement and have an influence on the observed process (Heisenberg’s uncertainty principle).
- Similar to a previous one: the survey questions are subject to different interpretation, so the results can be ambiguous.
- The lagging nature of the surveys make it hard to use this data for month to month improvement.
Direction Observation Is an Alternative
An alternative way to learn about the performance would be to use observation (see the Step 6 of 12 step system for challenging KPIs7).
Let’s take library service as an example. In additional to the annual surveys, one can use data that is already there in IT systems and track the actual use of library services and its usability for the students (in real-time). The metrics in this case will be similar to what webmasters track to improve their presence in Google.
An Example of How Various Approaches Can Be Combined
A good example of balanced set of KPIs for a library is Warwick Library’s Strategic Framework. They have some survey based indicators like:
- Satisfaction rates of final year students
- Satisfaction rates of postgraduate researchers
And they also have some usage-based metrics:
- Website pageviews
- Number of files retrieved
- Reading lists availability
Inducing Wrong Behaviour by Stressing Focus on Certain Indicators
We use indicators to improve, not to make things worse, but sometimes instead of helping to achieve desired results, indicators induce some unexpected behaviour.
Here is an example:
- Regulating authorities start pushing a university towards improving retention and graduation indicators with the idea that mentioned indicators will be improved by improving the quality of education and services.
- Universities in their turn responded by establishing higher admission standards.
The graduation rates improved, but the reason of the change is not the improvement in the quality of education.
Before, we have discussed a similar situation of indicators misuse in a business environment, I believe some findings from that article will work for the university scorecards as well.
Aligning Strategies of Different Levels of the Organization
The scorecard created for the management of the university will make less sense for other levers of the organizational structure. For example, universities’ libraries should have their own scorecard and respective performance indicators.
It is important to have a clear idea about how different scorecards support each other. You can learn more about the ways to do this in the “Cascading/Alignment” article.
Do Software Automation in Early Stages
In terms of software automation in the educational domain we see a positive trend. Many universities started using professional software for the purpose of building strategy maps and tracking KPIs. Among our users, we see more universities from Asia, Latin America and the Middle East.
If you are an education professional, then we invite you to sign-up with a free plan at BSC Designer Online.
To make your start easier, we suggest for you to use the University Scorecard template (with strategy map and KPIs) that was discussed in this article and that is publicly available (see the links in the end of the article).
BSC Designer team is interested in learning your story, feel free to share your findings in the comments.
- Follow our
 Strategy Implementation System to align stakeholders, strategic ambitions, and business frameworks into a comprehensive strategy.
 - Automate strategic planning with BSC Designer by organizing goals, initiatives, risks, and KPIs into scorecards.
More About Strategic Planning


- Anderson, A. (1991). No citation analyses please, we’re British. Science, 252(5006), 639. ↩
- E.V. Luneva, Key Performance Indicators (KPI) System in Education, Asian Social Science; Vol. 11, No. 8; 2015, Canadian Center of Science and Education ↩
- J.C. Burke, H. P. Minassians, The new accountability: From regulation to results. New Directions for Institutional Research, 2002 ↩
- D. Terkla, The most common performance indicators for institutions and their boards, Trusteeship Magazine, January/February, 2011 ↩
- University of Greenwich, Strategic Plan 2012–17: Summary ↩
- M. Arif, (2007) “Baldrige theory into practice: a generic model”, International Journal of Educational Management, Vol. 21 Iss: 2, pp.114 – 125 ↩
- A. Savkin, 12 Steps System for the Most Challenging Metrics and KPIs, 2016, bscdesigner.com ↩
![]() CEO | Author | Speaker
CEO | Author | Speaker
BSC Designer is strategy execution software that enhances strategy formulation and execution through tangible KPIs. Our proprietary strategy implementation system reflects our practical experience in the strategy domain.