These two buzzwords cause confusion among business professionals as they are used synonymously. From the first look, one might have an impression that “dashboard” and “scorecard” are interchangeable, but there are some important distinctions that I’d like to analyze in this article.
I’m presenting the results of the comparative analysis in the form of a table. I compare “dashboard” and “scorecard.” As long as the most used form of the “scorecard” today is a Balanced Scorecard, in my analysis I’ll focus on this very framework.
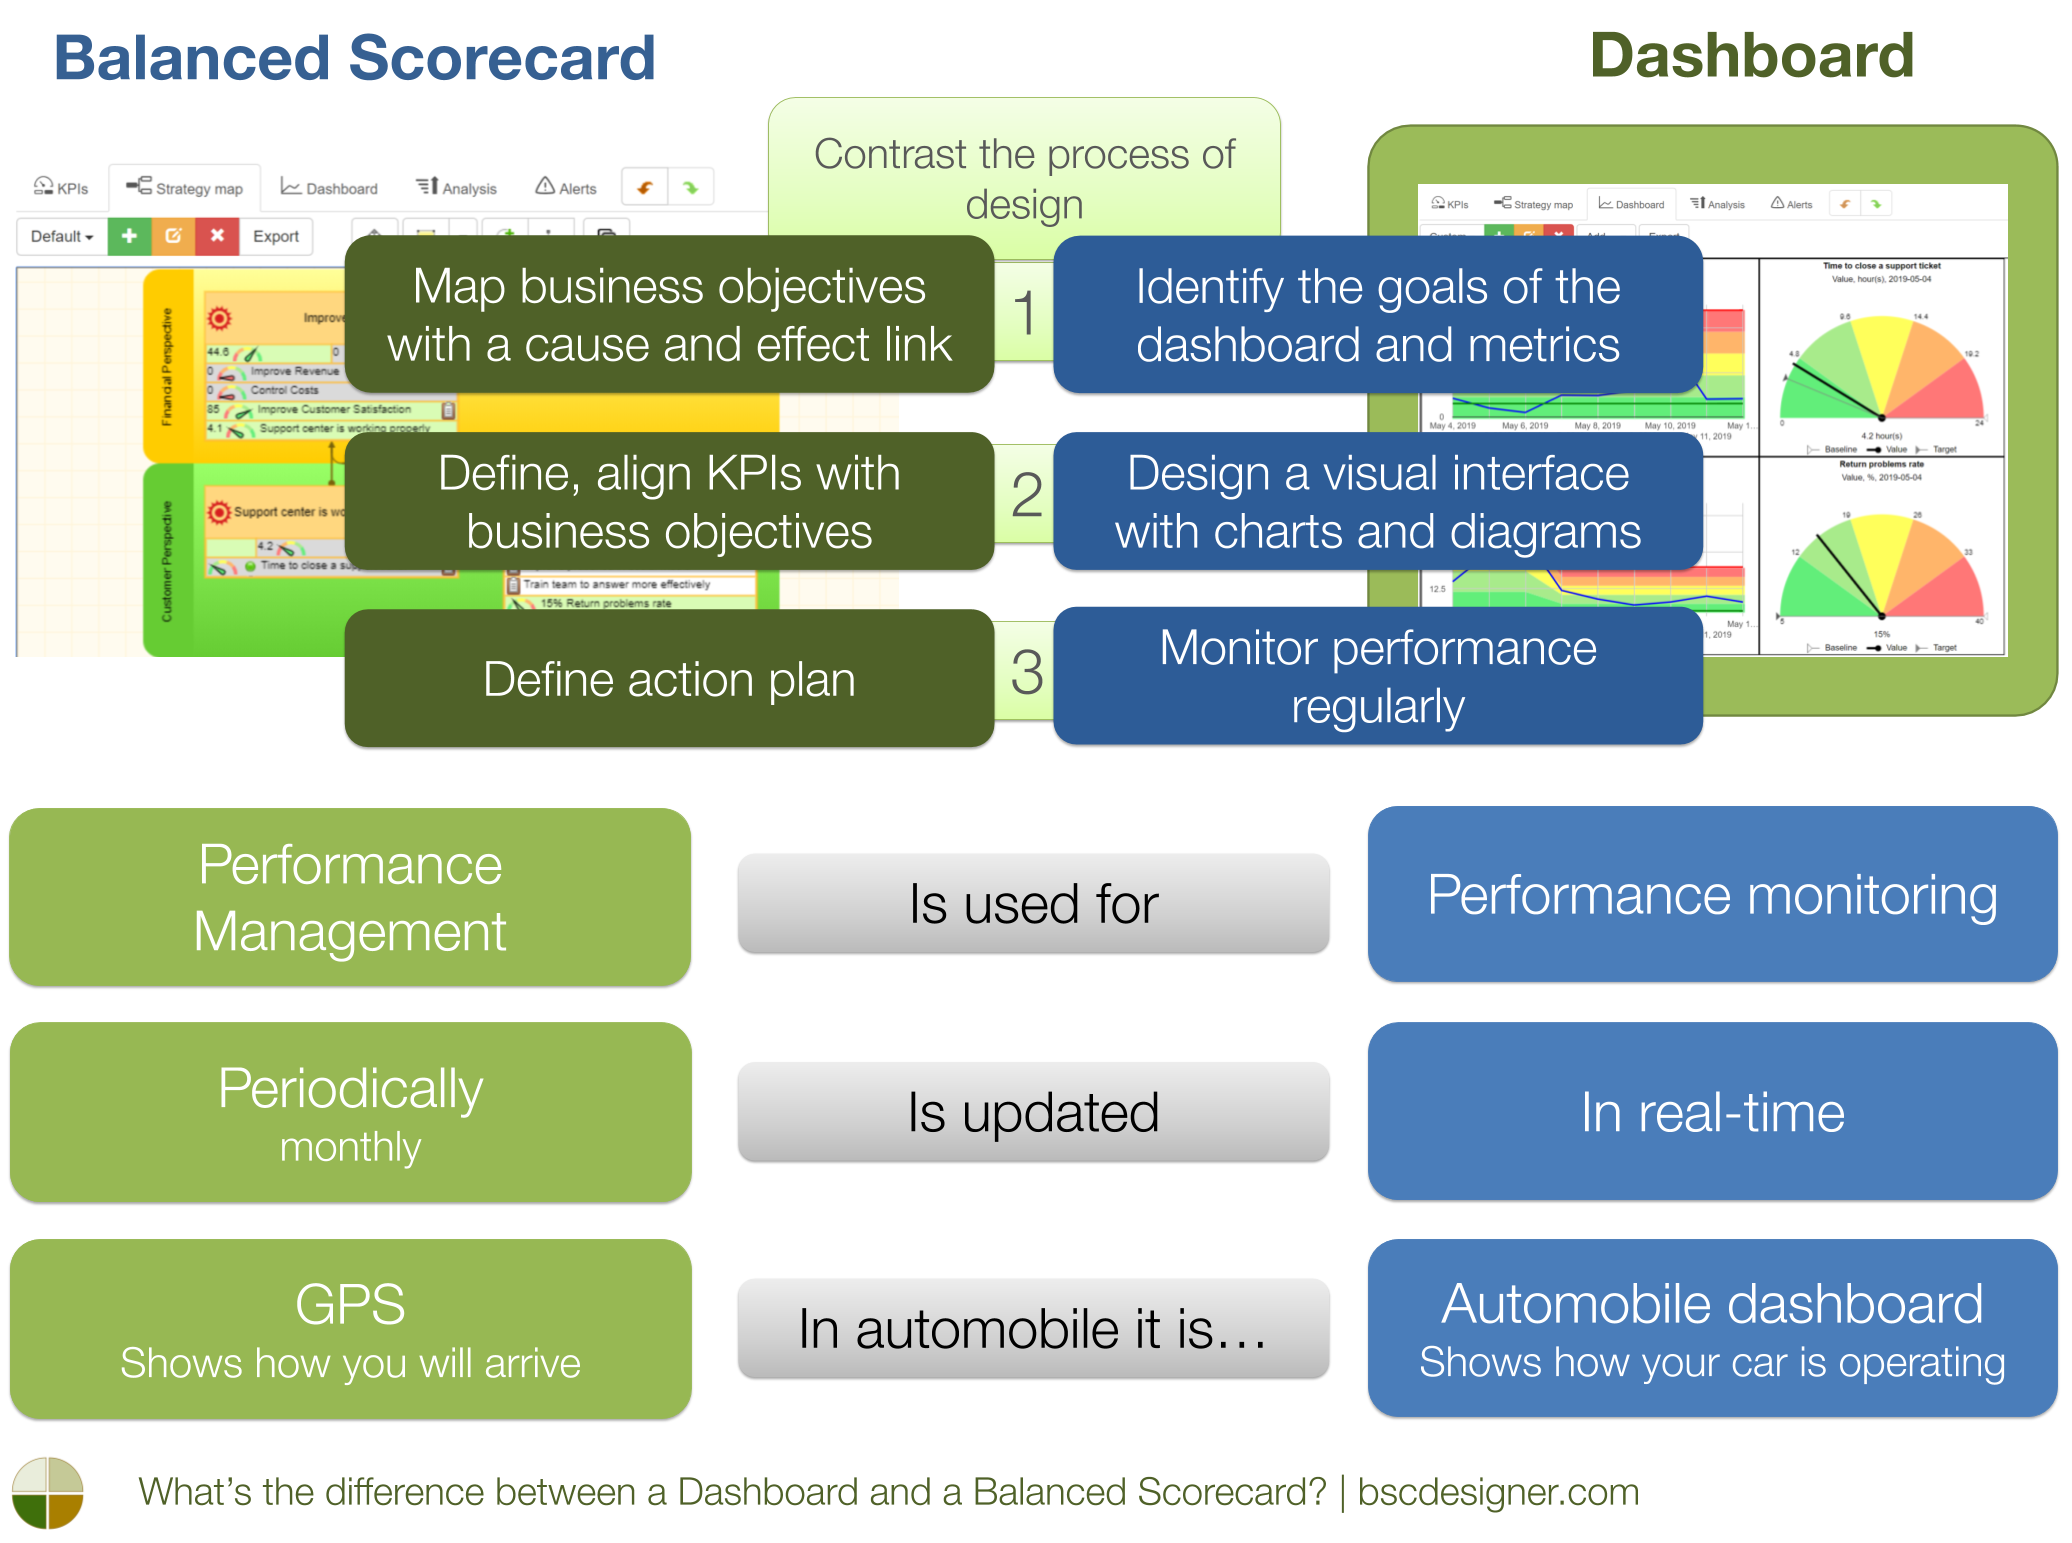
The Differences Between a Dashboard and a Balanced Scorecard
| Dashboard | Balanced Scorecard | |
|---|---|---|
| Is used for… | performance measurement / monitoring | performance management |
| As a measurement tool is… | metric | KPI (Metric + Target) – learn more about the difference between metric and KPI |
| Measure is linked to business objectives… | is not linked | linked (aligned) |
| It measures… | performance | progress (the current value versus the target value) |
| It is updated… | in real-time | periodically (monthly) |
| It focuses on… | operational (short-term) goals | strategic (long-term) goals (more about the difference between strategic and operational goal) |
| Its purpose is to… | give a high-level idea of what is happening in the company | plan and execute a strategy, identify why something is happening and what can be done about that |
| Its helps… | visualize the performance to understand the current state | align objectives, KPI, and actions to see the connection between them |
| In automobile it is… | automobile dashboard (shows how your car is operating) | GPS (shows when and how you will arrive) |
Contrast the Process of Design
The Balanced Scorecard design process is up to down (with some exceptions). It starts with global business objectives and then moves down to KPIs level.The dashboard is more oriented on an operational level; as a result the process starts with the identification of relevant metrics and monitoring of their values. If something happens on the dashboard, an executive needs to analyze the cause and effect connection between various parts of the business system to find out what is needed to be done to fix the problem.
| Dashboard Process | Balanced Scorecard Process |
|---|---|
| 1. Identify the goals of the dashboard and metrics | 1. Identify and map business objectives on the strategy map with a case-and-effect connection |
| 2. Design a visual interface with charts and diagrams | 2. Define KPIs with targets and benchmarks, align KPIs with business objectives |
| 3. Monitor performance regularly | 3. Define action plan according to the strategic objectives |
Contrast the Process of Usage
The dashboard and the Balanced Scorecard are tactical and strategic tools respectively. Their usage processes are different as well.
| Dashboard Process | Balanced Scorecard Process |
|---|---|
| 1. Business system generates events. Performance of the process is calculated and presented in the form of measures | 1. Responsible employee follows business objectives from the strategy map |
| 2. Operational dashboard visualizes measurements in the form of a chart, a diagram or a gauge | 2. Employee executes the action plan that is aligned to the specific business objective and it is measured with selected KPIs |
| 3. If the performance of the process is not on the normal level, a dashboard generates notification to the responsible manager | 3. KPI is reported to the Balanced Scorecard, its value is compared with target values and thresholds (stop-lights):
|
| 4. Responsible manager researches and follows cause and effect links to identify and fix the problem in a timely manner | 4. Responsible manager tracks the progress according to a developed plan and suggests updates when necessary |
Common Features of a Dashboard and a Balanced Scorecard
Let’s have a look at the common features of BI dashboards and strategy scorecards.
The Users of a Dashboard and a Scorecard
It is hard to distinguish who uses the dashboard and who uses the Balanced Scorecard. Some companies reported that their Balanced Scorecard is available only for executives, other prefer to share it with all of their employees.
A Dashboard is supposed to be available for supervisor roles only, but some companies think that this valuable information can help line-level employees in their daily job as well.
Dig into Cause and Effect
What happens when a supervisor receives a warning signal generated by a dashboard? After having a first look at what is going on a supervisor is supposed to understand the cause and effect relation between business objectives, actions and measures.
That sounds very close to what the Balanced Scorecard framework suggests doing with business objectives on the strategy map.
Measure and KPI
Although many sources tend to differentiate measures (no target) and KPIs (with target), in practice most companies follow the idea of the KPI in the dashboard as well by assigning some synthetic benchmark.
Dashboard Example
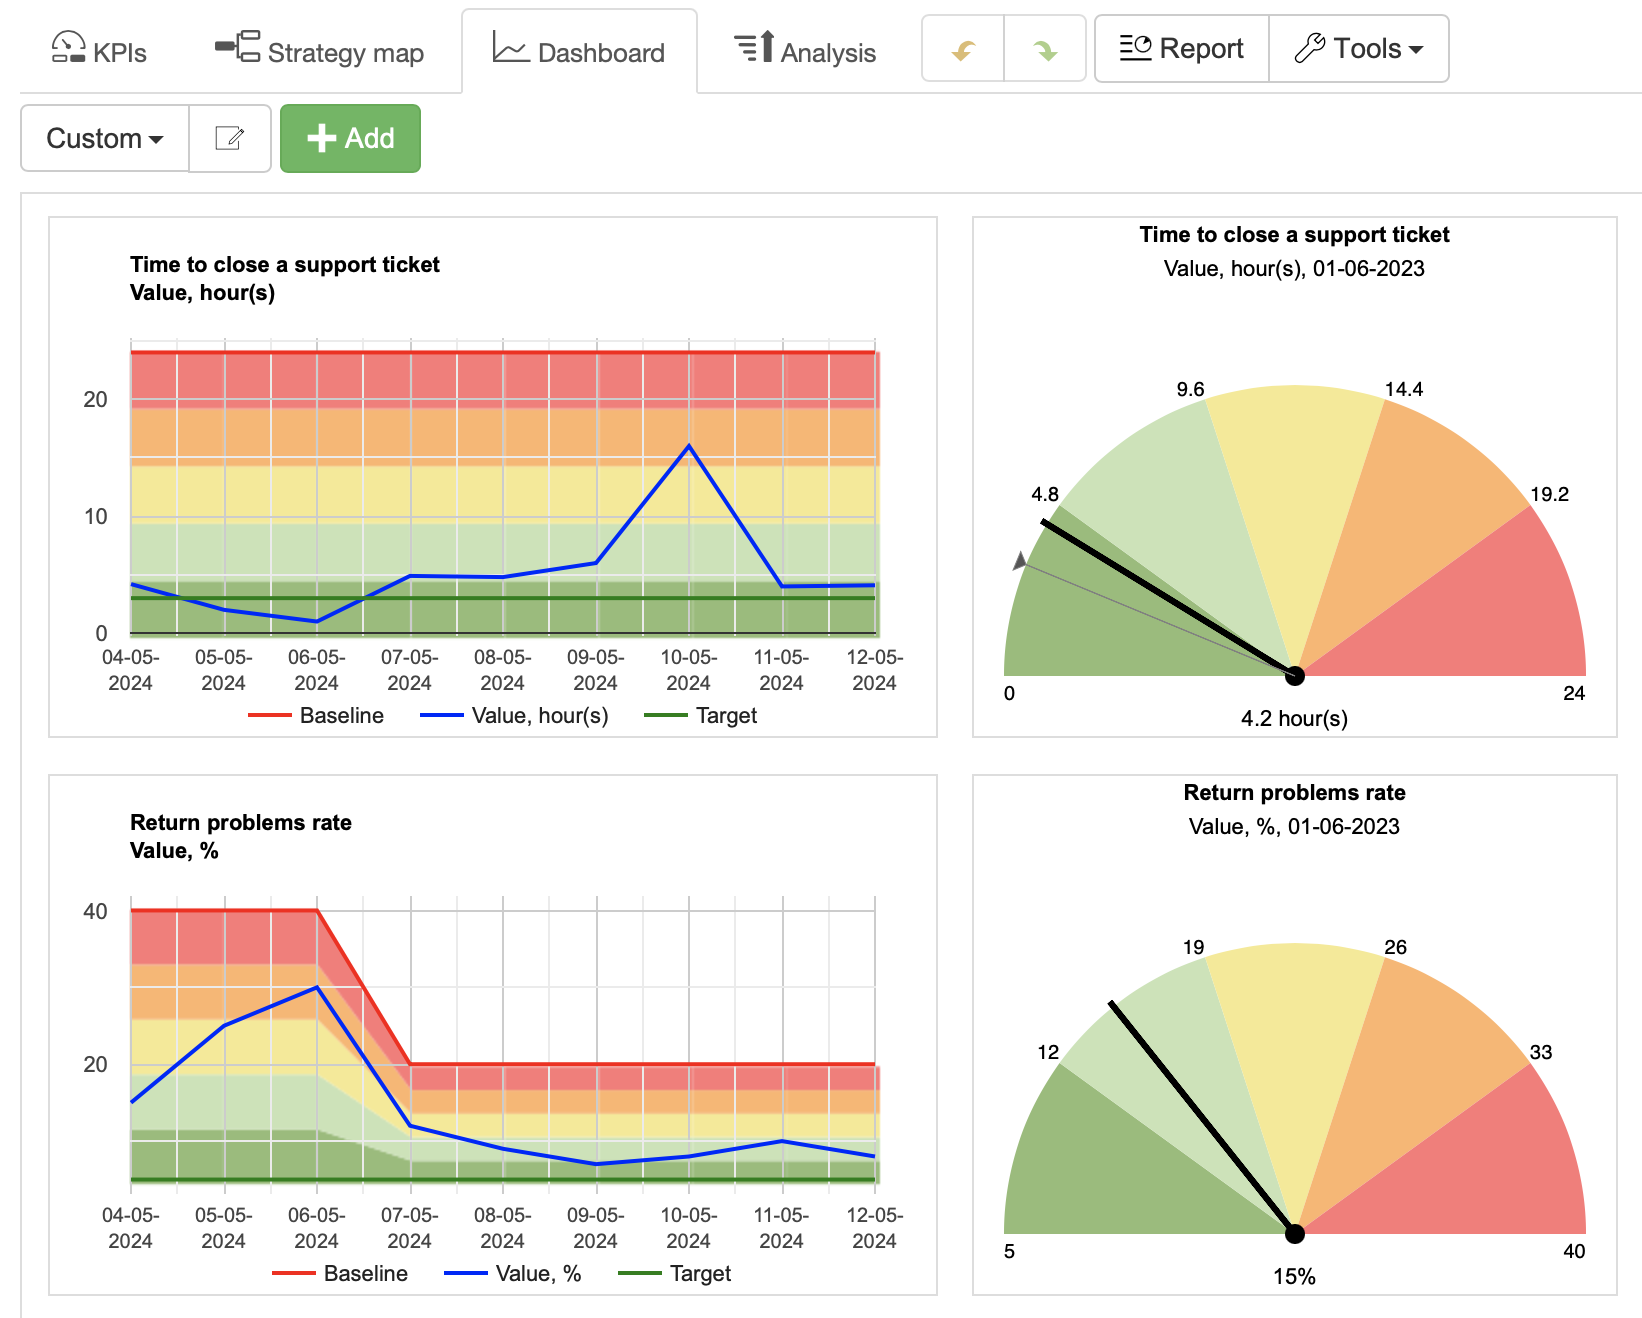
Dashboard helps to get an idea of how customer service is performing now:
PROs:
- We can track current performance data
- Historical information is displayed for the metrics
CONs:
- It is not clear how certain metrics contribute to the overall strategy
- The action plan for the KPIs is not displayed
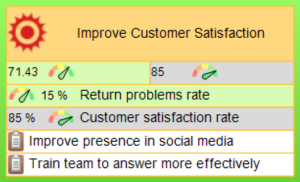
Balanced Scorecard Example
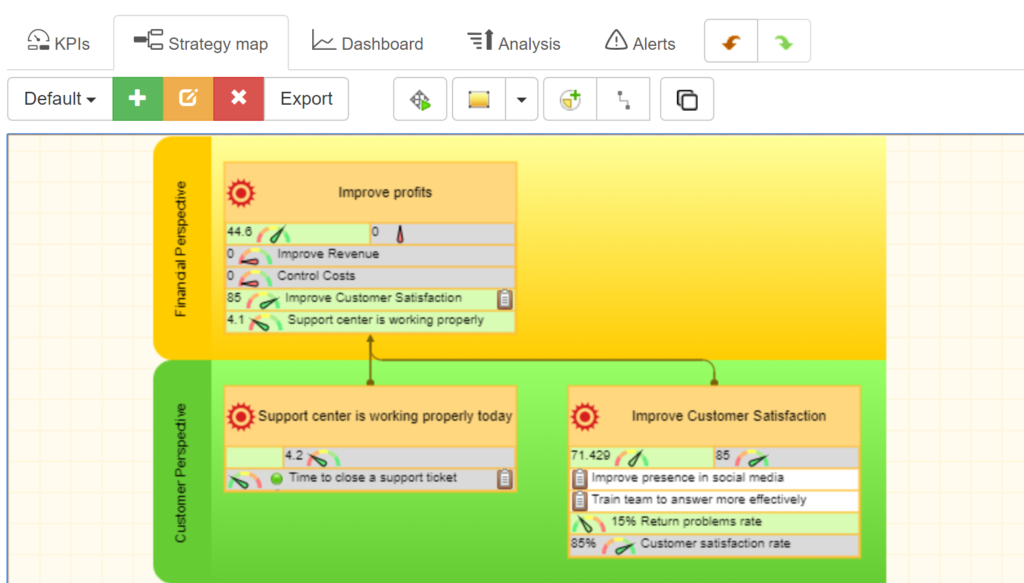
The Balanced Scorecard’s strategy map allows to see the big picture of what’s happening in the organization.
PROs:
- We can see the business goals and cause-and-effect connections between them
- Initiatives and metrics are visualized on a single page
CONs:
- We don’t have space to visualize all operational indicators here
- We don’t see historical data for the indicators
More Examples of Dashboards and Strategy Scorecards
At the examples page, you will find more business scorecards that combine BI dashboards and Strategy Scorecards. In this example, we specifically discussed the best practices for designing dashboards.

Automation of the Dashboard and Strategy Scorecards
Users of BSC Designer can easily automate both dashboards and strategy maps in the same scorecard. You can find more details in the respective section of the manual for Dashboards and for Strategy Maps.
What do you think about a dashboard/balanced scorecard hybrid? Please share your thoughts in the comments below.
What's next?- Follow our
 Strategy Implementation System to align stakeholders, strategic ambitions, and business frameworks into a comprehensive strategy.
 - Automate strategic planning with BSC Designer by organizing goals, initiatives, risks, and KPIs into scorecards.
More About Strategic Planning


![]() CEO | Author | Speaker
CEO | Author | Speaker
BSC Designer is strategy execution software that enhances strategy formulation and execution through tangible KPIs. Our proprietary strategy implementation system reflects our practical experience in the strategy domain.
Interesting article. Most people are not sure about the difference between scorecard and dashboard. Thanks for clarifying. Both are important and serve difference purpose.
Excellent learning text and very understandable! Few CEOs, business strategists, performance managers, and program/project managers know these substantial differences.
Congratulations!
Thank you for sharing your feedback!